Deck 7: Introduction to Linear Regression
Full screen (f)
Question
Consider the following to answer the question(s) below:
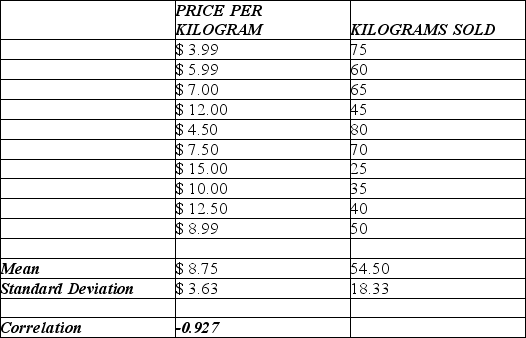
A small independent organic food store offers a variety of specialty coffees. To determine whether price has an impact on sales, the managers kept track of how many kilograms of each variety of coffee were sold last month. The data, scatterplot and summary statistics are shown below.
The intercept of the estimated regression line that relates the response variable (monthly sales) to the predictor variable (price per kilogram) is
A) 95.47
B) 0.858
C) -4.684
D) -0.858
E) -8.999
Question
Consider the following to answer the question(s) below:
A small independent organic food store offers a variety of specialty coffees. To determine whether price has an impact on sales, the managers kept track of how many kilograms of each variety of coffee were sold last month. The data, scatterplot, and summary statistics are shown below.


Find the value of R2. Interpret its meaning in this context.
A small independent organic food store offers a variety of specialty coffees. To determine whether price has an impact on sales, the managers kept track of how many kilograms of each variety of coffee were sold last month. The data, scatterplot, and summary statistics are shown below.
Find the value of R2. Interpret its meaning in this context.
Question
Consider the following to answer the question(s) below:
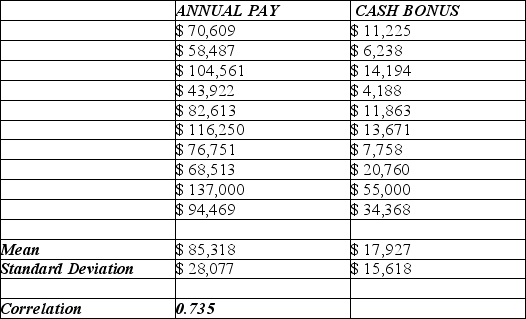
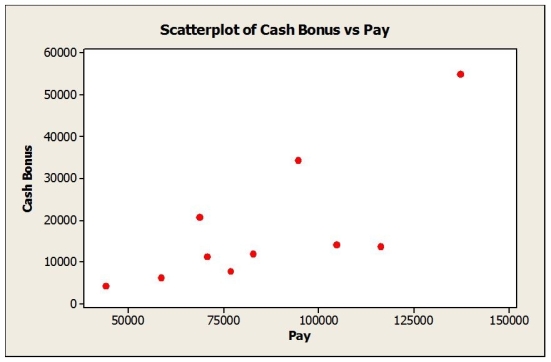
To determine whether the cash bonuses paid by Johnson Financial Group are related to annual pay, data were gathered for 10 account executives who received such bonuses in 2007. The data, scatterplot and summary statistics are shown below.

Find the value of R2. Interpret its meaning in this context.
To determine whether the cash bonuses paid by Johnson Financial Group are related to annual pay, data were gathered for 10 account executives who received such bonuses in 2007. The data, scatterplot and summary statistics are shown below.
Find the value of R2. Interpret its meaning in this context.
Question
Consider the following to answer the question(s) below:
To determine whether the cash bonuses paid by Johnson Financial Group are related to annual pay, data were gathered for 10 account executives who received such bonuses in 2007. The data, scatterplot and summary statistics are shown below.
The slope of the estimated regression line that relates the response variable (cash bonus) to the predictor variable (annual pay) is
A) 0.409
B) -16945
C) 0.54
D) 3.45
E) none of the above
Question
Consider the following to answer the question(s) below:
A small independent organic food store offers a variety of specialty coffees. To determine whether price has an impact on sales, the managers kept track of how many kilograms of each variety of coffee were sold last month. The data, scatterplot, and summary statistics are shown below.
Use the estimated regression equation to answer the following questions.
a. Estimate the monthly sales for a variety of coffee that costs $20.00 per kilogram.
b. How confident should you be in this estimate? Explain.
Question
Consider the following to answer the question(s) below:
To determine whether the cash bonuses paid by Johnson Financial Group are related to annual pay, data were gathered for 10 account executives who received such bonuses in 2007. The data, scatterplot and summary statistics are shown below.
The intercept of the estimated regression line that relates the response variable (cash bonus) to the predictor variable (annual pay) is
A) 0.409
B) -16945
C) 0.54
D) 3.45
E) none of the above
Question
Consider the following to answer the question(s) below:
A small independent organic food store offers a variety of specialty coffees. To determine whether price has an impact on sales, the managers kept track of how many kilograms of each variety of coffee were sold last month. The data, scatterplot and summary statistics are shown below.
Which of the following statements is true?
A) The quantitative variable condition is not satisfied.
B) The linearity condition is not satisfied.
C) There are obvious outliers.
D) The quantitative variable condition is satisfied.
E) The Y-intercept of the line of best fit is approximately zero.
Question
Consider the following to answer the question(s) below:
To determine whether the cash bonuses paid by Johnson Financial Group are related to annual pay, data were gathered for 10 account executives who received such bonuses in 2007. The data, scatterplot and summary statistics are shown below.
Using the regression equation,
a. Estimate the cash bonus for an executive at Johnson Financial earning $82,613 a year.
b. What is the residual for this estimate? What does it mean?
Question
Consider the following to answer the question(s) below:
A small independent organic food store offers a variety of specialty coffees. To determine whether price has an impact on sales, the managers kept track of how many kilograms of each variety of coffee were sold last month. The data, scatterplot and summary statistics are shown below.
The slope of the estimated regression line that relates the response variable (monthly sales) to the predictor variable (price per kilogram) is
A) 95.47
B) 0.858
C) -4.684
D) -0.858
E) -8.999
Question
Consider the following to answer the question(s) below:
A small independent organic food store offers a variety of specialty coffees. To determine whether price has an impact on sales, the managers kept track of how many kilograms of each variety of coffee were sold last month. The data, scatterplot, and summary statistics are shown below.
Use the estimated regression equation to answer the following questions.
a. Estimate the monthly sales for a variety of coffee that costs $12.00 per kilogram.
b. What is the residual for this estimate? What does it mean?
Question
Consider the following to answer the question(s) below:
To determine whether the cash bonuses paid by Johnson Financial Group are related to annual pay, data were gathered for 10 account executives who received such bonuses in 2007. The data, scatterplot and summary statistics are shown below.
The residual for the estimated cash bonus of an executive at Johnson Financial earning $82, 613 a year would be
A) $0
B) -$4,981
C) -$15,819
D) -$4,958
E) $15,819
Question
Consider the following to answer the question(s) below:
A small independent organic food store offers a variety of specialty coffees. To determine whether price has an impact on sales, the managers kept track of how many kilograms of each variety of coffee were sold last month. The data, scatterplot, and summary statistics are shown below.
Below is a plot showing residuals versus fitted values for the estimated regression equation relating monthly sales of coffee to price per kilogram. Are all the conditions for linear regression met? Explain.
Question
Consider the following to answer the question(s) below:
To determine whether the cash bonuses paid by Johnson Financial Group are related to annual pay, data were gathered for 10 account executives who received such bonuses in 2007. The data, scatterplot and summary statistics are shown below.
Estimate the linear regression model that relates the response variable (cash bonus) to the predictor variable (annual pay).
a. Find the slope of the regression line.
b. Find the intercept of the regression line.
c. Write the equation of the linear model.
Question
Consider the following to answer the question(s) below:
To determine whether the cash bonuses paid by Johnson Financial Group are related to annual pay, data were gathered for 10 account executives who received such bonuses in 2007. The data, scatterplot and summary statistics are shown below.
Below is a plot showing residuals versus fitted values for the estimated regression equation relating cash bonus to pay for the account executives at Johnson Financial. Are all the conditions for linear regression met? Explain.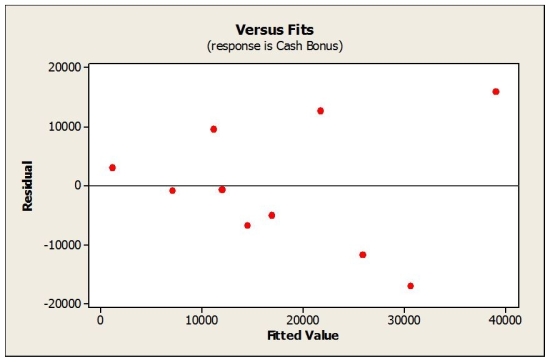
Question
Consider the following to answer the question(s) below:
To determine whether the cash bonuses paid by Johnson Financial Group are related to annual pay, data were gathered for 10 account executives who received such bonuses in 2007. The data, scatterplot and summary statistics are shown below.
Use the regression equation to answer the following questions.
a. Estimate the cash bonus for an executive at Johnson Financial earning $200,000 a year.
b. How confident should you be in this estimate? Explain.
Question
Consider the following to answer the question(s) below:
A small independent organic food store offers a variety of specialty coffees. To determine whether price has an impact on sales, the managers kept track of how many kilograms of each variety of coffee were sold last month. The data, scatterplot, and summary statistics are shown below.
Estimate the linear regression model that relates the response variable (monthly sales) to the predictor variable (price per kilogram).
a. Find the slope of the regression line.
b. Find the intercept of the regression line.
c. Write the equation of the linear model.
Question
Consider the following to answer the question(s) below:
A small independent organic food store offers a variety of specialty coffees. To determine whether price has an impact on sales, the managers kept track of how many kilograms of each variety of coffee were sold last month. The data, scatterplot, and summary statistics are shown below.
Comment on whether each of the following conditions for correlation / linear regression is met.
a. Quantitative variable condition.
b. Linearity condition.
c. Outlier condition.
Question
Consider the following to answer the question(s) below:
To determine whether the cash bonuses paid by Johnson Financial Group are related to annual pay, data were gathered for 10 account executives who received such bonuses in 2007. The data, scatterplot and summary statistics are shown below.
Comment on whether each of the following conditions for correlation / linear regression is met.
a. Quantitative variable condition.
b. Linearity condition.
c. Outlier condition.
Question
Consider the following to answer the question(s) below:
To determine whether the cash bonuses paid by Johnson Financial Group are related to annual pay, data were gathered for 10 account executives who received such bonuses in 2007. The data, scatterplot and summary statistics are shown below.
What percent of the variability in cash bonuses can be explained by pay?
A) 100%
B) 85%
C) 73%
D) 30%
E) 54%
Question
Consider the following to answer the question(s) below:
To determine whether the cash bonuses paid by Johnson Financial Group are related to annual pay, data were gathered for 10 account executives who received such bonuses in 2007. The data, scatterplot and summary statistics are shown below.
Based on the estimated regression line, the cash bonus for an executive at Johnson Financial earning $82, 613 a year would be
A) $11,863
B) $16,844
C) $27,682
D) $4,958
E) $15,819
Question
Consider the following to answer the question(s) below:
A small independent organic food store offers a variety of specialty coffees. To determine whether price has an impact on sales, the managers kept track of how many kilograms of each variety of coffee were sold last month. The data, scatterplot and summary statistics are shown below.
Below is a plot showing residuals versus fitted values for the estimated regression equation relating monthly sales of coffee to price per kilogram. Based on this plot we can say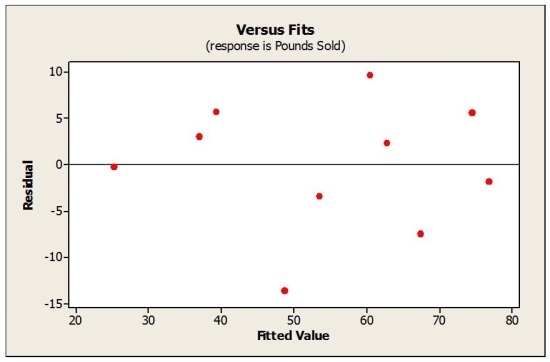
A) The linearity condition is not satisfied.
B) The linearity condition is reasonably satisfied.
C) A slight thickening of the plot is definitely not evident.
D) The correlation coefficient is close to one.
E) Nothing related to regression analysis can be said based on this graph.
Question
Consider the following to answer the question(s) below:
A small independent organic food store offers a variety of specialty coffees. To determine whether price has an impact on sales, the managers kept track of how many kilograms of each variety of coffee were sold last month. The data, scatterplot and summary statistics are shown below.
A regression on a pair of variables, x and y, results in the value of R2 equal to 0.7834. Which of the following statements is true?
A) The correlation between x and y must be 0.7834.
B) The correlation between x and y must be -0.8851.
C) The correlation between x and y must be -0.7834.
D) The correlation between x and y must be either 0.8851 or -0.8851.
E) The correlation between x and y must be 0.8851.
Question
Consider the following to answer the question(s) below:
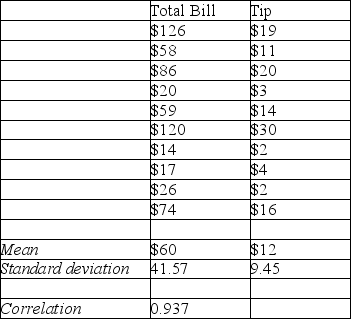
To determine whether the tip left at the end of a meal is related to the size of the total bill at their restaurant, Chez Michelle, data were gathered for 10 customers. The data and summary statistics are shown below.
The residual for the estimated tip for a total bill of $120 would be
A) $5.13
B) $19.00
C) 0
D) -$11.45
E) $9.38
Question
Consider the following to answer the question(s) below:
To determine whether the tip left at the end of a meal is related to the size of the total bill at their restaurant, Chez Michelle, data were gathered for 10 customers. The data and summary statistics are shown below.
The slope of the estimated regression line that relates the response variable (tip) to the predictor variable (total bill) is
A) 0.2128
B) -0.2128
C) 0.8773
D) 0.9366
E) -0.9367
Question
Consider the following to answer the question(s) below:
To determine whether the tip left at the end of a meal is related to the size of the total bill at their restaurant, Chez Michelle, data were gathered for 10 customers. The data and summary statistics are shown below.
Which of the following is a correct interpretation for the regression slope coefficient b1?
A) The average change in y of a one-unit change in x will be b1 units.
B) For a one-unit change in y, we can expect the value of the independent variable to change by b1 units on average.
C) For each unit change in x, the dependent variable will change by b1 units.
D) The average change in x of a one-unit change in y will be b1 units.
E) The change in y of a one-unit change in x will always be b1 units.
Question
Consider the following to answer the question(s) below:
To determine whether the tip left at the end of a meal is related to the size of the total bill at their restaurant, Chez Michelle, data were gathered for 10 customers. The data and summary statistics are shown below.
A manufacturing company is interested in predicting the number of defects (y) that will be produced each hour on the assembly line (x). Using sample data they estimate the equation as defects = 5.67 + 0.048 (hours). Which of the following statements is true?
A) The correlation between x and y is positive.
B) 4.8% of the variability in y is explained by x.
C) 23.08% of the variability in y is explained by x.
D) An increase in x of one-unit will result in an average increase of 5.67 in y.
E) The relationship between x and y could be either positive or negative.
Question
Consider the following to answer the question(s) below:
To determine whether the tip left at the end of a meal is related to the size of the total bill at their restaurant, Chez Michelle, data were gathered for 10 customers. The data and summary statistics are shown below.
The percentage of the variability in tips that can be explained by the total bill is
A) 87.7%
B) 93.7%
C) 21.3%
D) 66.8%
E) 96.8%
Question
Consider the following to answer the question(s) below:
To determine whether the tip left at the end of a meal is related to the size of the total bill at their restaurant, Chez Michelle, data were gathered for 10 customers. The data and summary statistics are shown below.
The intercept of the estimated regression line that relates the response variable (tip) to the predictor variable (total bill) is
A) -0.6684
B) 57.42
C) 0.6684
D) 0.5950
E) none of these
Question
Consider the following to answer the question(s) below:
To determine whether the tip left at the end of a meal is related to the size of the total bill at their restaurant, Chez Michelle, data were gathered for 10 customers. The data and summary statistics are shown below.
The regression equation would predict what size of tip if the total bill was $120?
A) $24.87
B) $15.55
C) $26.03
D) $30.00
E) $20.62
Question
Consider the following to answer the question(s) below:
To determine whether the tip left at the end of a meal is related to the size of the total bill at their restaurant, Chez Michelle, data were gathered for 10 customers. The data and summary statistics are shown below.
If a residual plot exhibits a curved pattern in the residuals, this means that
A) The relationship between x and y is also curved.
B) The residuals are not normally distributed.
C) x and y are positively correlated.
D) The residuals have a constant variance.
E) The relationship between x and y is linear.
Question
Consider the following to answer the question(s) below:
A small independent organic food store offers a variety of specialty coffees. To determine whether price has an impact on sales, the managers kept track of how many kilograms of each variety of coffee were sold last month. The data, scatterplot and summary statistics are shown below.
What percent of the variability in the number of kilograms of coffee sold per month can be explained by price?
A) 95.47%
B) 100%
C) 85.8%
D) 55.6%
E) 4.68%
Question
Consider the following to answer the question(s) below:
A small independent organic food store offers a variety of specialty coffees. To determine whether price has an impact on sales, the managers kept track of how many kilograms of each variety of coffee were sold last month. The data, scatterplot and summary statistics are shown below.
A pair of variables, x and y, have a correlation coefficient of -0.8851. Which of the following statements is true?
A) x explains about 78.34 percent of the variation in y.
B) x explains about 88.51 percent of the variation in y.
C) y explains about 78.34 percent of the variation in x.
D) x cannot explain about 78.34 percent of the variation in y.
E) y explains about 88.51 percent of the variation in x.

Unlock Deck
Sign up to unlock the cards in this deck!
Unlock Deck
Unlock Deck
1/32
Play
Full screen (f)
Deck 7: Introduction to Linear Regression
1
Consider the following to answer the question(s) below:
A small independent organic food store offers a variety of specialty coffees. To determine whether price has an impact on sales, the managers kept track of how many kilograms of each variety of coffee were sold last month. The data, scatterplot and summary statistics are shown below.
The intercept of the estimated regression line that relates the response variable (monthly sales) to the predictor variable (price per kilogram) is
A) 95.47
B) 0.858
C) -4.684
D) -0.858
E) -8.999
A
2
Consider the following to answer the question(s) below:
A small independent organic food store offers a variety of specialty coffees. To determine whether price has an impact on sales, the managers kept track of how many kilograms of each variety of coffee were sold last month. The data, scatterplot, and summary statistics are shown below.
Find the value of R2. Interpret its meaning in this context.
0.858, which means that 85.8% of the variability in the number of kilograms of coffee sold per month is explained by price.
3
Consider the following to answer the question(s) below:
To determine whether the cash bonuses paid by Johnson Financial Group are related to annual pay, data were gathered for 10 account executives who received such bonuses in 2007. The data, scatterplot and summary statistics are shown below.
Find the value of R2. Interpret its meaning in this context.
To determine whether the cash bonuses paid by Johnson Financial Group are related to annual pay, data were gathered for 10 account executives who received such bonuses in 2007. The data, scatterplot and summary statistics are shown below.
Find the value of R2. Interpret its meaning in this context.
0.54, which means that 54% of the variability in cash bonuses can be explained by pay.
4
Consider the following to answer the question(s) below:
To determine whether the cash bonuses paid by Johnson Financial Group are related to annual pay, data were gathered for 10 account executives who received such bonuses in 2007. The data, scatterplot and summary statistics are shown below.
The slope of the estimated regression line that relates the response variable (cash bonus) to the predictor variable (annual pay) is
A) 0.409
B) -16945
C) 0.54
D) 3.45
E) none of the above
Unlock Deck
Unlock for access to all 32 flashcards in this deck.
Unlock Deck
k this deck
5
Consider the following to answer the question(s) below:
A small independent organic food store offers a variety of specialty coffees. To determine whether price has an impact on sales, the managers kept track of how many kilograms of each variety of coffee were sold last month. The data, scatterplot, and summary statistics are shown below.
Use the estimated regression equation to answer the following questions.
a. Estimate the monthly sales for a variety of coffee that costs $20.00 per kilogram.
b. How confident should you be in this estimate? Explain.
Unlock Deck
Unlock for access to all 32 flashcards in this deck.
Unlock Deck
k this deck
6
Consider the following to answer the question(s) below:
To determine whether the cash bonuses paid by Johnson Financial Group are related to annual pay, data were gathered for 10 account executives who received such bonuses in 2007. The data, scatterplot and summary statistics are shown below.
The intercept of the estimated regression line that relates the response variable (cash bonus) to the predictor variable (annual pay) is
A) 0.409
B) -16945
C) 0.54
D) 3.45
E) none of the above
Unlock Deck
Unlock for access to all 32 flashcards in this deck.
Unlock Deck
k this deck
7
Consider the following to answer the question(s) below:
A small independent organic food store offers a variety of specialty coffees. To determine whether price has an impact on sales, the managers kept track of how many kilograms of each variety of coffee were sold last month. The data, scatterplot and summary statistics are shown below.
Which of the following statements is true?
A) The quantitative variable condition is not satisfied.
B) The linearity condition is not satisfied.
C) There are obvious outliers.
D) The quantitative variable condition is satisfied.
E) The Y-intercept of the line of best fit is approximately zero.
Unlock Deck
Unlock for access to all 32 flashcards in this deck.
Unlock Deck
k this deck
8
Consider the following to answer the question(s) below:
To determine whether the cash bonuses paid by Johnson Financial Group are related to annual pay, data were gathered for 10 account executives who received such bonuses in 2007. The data, scatterplot and summary statistics are shown below.
Using the regression equation,
a. Estimate the cash bonus for an executive at Johnson Financial earning $82,613 a year.
b. What is the residual for this estimate? What does it mean?
Unlock Deck
Unlock for access to all 32 flashcards in this deck.
Unlock Deck
k this deck
9
Consider the following to answer the question(s) below:
A small independent organic food store offers a variety of specialty coffees. To determine whether price has an impact on sales, the managers kept track of how many kilograms of each variety of coffee were sold last month. The data, scatterplot and summary statistics are shown below.
The slope of the estimated regression line that relates the response variable (monthly sales) to the predictor variable (price per kilogram) is
A) 95.47
B) 0.858
C) -4.684
D) -0.858
E) -8.999
Unlock Deck
Unlock for access to all 32 flashcards in this deck.
Unlock Deck
k this deck
10
Consider the following to answer the question(s) below:
A small independent organic food store offers a variety of specialty coffees. To determine whether price has an impact on sales, the managers kept track of how many kilograms of each variety of coffee were sold last month. The data, scatterplot, and summary statistics are shown below.
Use the estimated regression equation to answer the following questions.
a. Estimate the monthly sales for a variety of coffee that costs $12.00 per kilogram.
b. What is the residual for this estimate? What does it mean?
Unlock Deck
Unlock for access to all 32 flashcards in this deck.
Unlock Deck
k this deck
11
Consider the following to answer the question(s) below:
To determine whether the cash bonuses paid by Johnson Financial Group are related to annual pay, data were gathered for 10 account executives who received such bonuses in 2007. The data, scatterplot and summary statistics are shown below.
The residual for the estimated cash bonus of an executive at Johnson Financial earning $82, 613 a year would be
A) $0
B) -$4,981
C) -$15,819
D) -$4,958
E) $15,819
Unlock Deck
Unlock for access to all 32 flashcards in this deck.
Unlock Deck
k this deck
12
Consider the following to answer the question(s) below:
A small independent organic food store offers a variety of specialty coffees. To determine whether price has an impact on sales, the managers kept track of how many kilograms of each variety of coffee were sold last month. The data, scatterplot, and summary statistics are shown below.
Below is a plot showing residuals versus fitted values for the estimated regression equation relating monthly sales of coffee to price per kilogram. Are all the conditions for linear regression met? Explain.
Unlock Deck
Unlock for access to all 32 flashcards in this deck.
Unlock Deck
k this deck
13
Consider the following to answer the question(s) below:
To determine whether the cash bonuses paid by Johnson Financial Group are related to annual pay, data were gathered for 10 account executives who received such bonuses in 2007. The data, scatterplot and summary statistics are shown below.
Estimate the linear regression model that relates the response variable (cash bonus) to the predictor variable (annual pay).
a. Find the slope of the regression line.
b. Find the intercept of the regression line.
c. Write the equation of the linear model.
Unlock Deck
Unlock for access to all 32 flashcards in this deck.
Unlock Deck
k this deck
14
Consider the following to answer the question(s) below:
To determine whether the cash bonuses paid by Johnson Financial Group are related to annual pay, data were gathered for 10 account executives who received such bonuses in 2007. The data, scatterplot and summary statistics are shown below.
Below is a plot showing residuals versus fitted values for the estimated regression equation relating cash bonus to pay for the account executives at Johnson Financial. Are all the conditions for linear regression met? Explain.
Unlock Deck
Unlock for access to all 32 flashcards in this deck.
Unlock Deck
k this deck
15
Consider the following to answer the question(s) below:
To determine whether the cash bonuses paid by Johnson Financial Group are related to annual pay, data were gathered for 10 account executives who received such bonuses in 2007. The data, scatterplot and summary statistics are shown below.
Use the regression equation to answer the following questions.
a. Estimate the cash bonus for an executive at Johnson Financial earning $200,000 a year.
b. How confident should you be in this estimate? Explain.
Unlock Deck
Unlock for access to all 32 flashcards in this deck.
Unlock Deck
k this deck
16
Consider the following to answer the question(s) below:
A small independent organic food store offers a variety of specialty coffees. To determine whether price has an impact on sales, the managers kept track of how many kilograms of each variety of coffee were sold last month. The data, scatterplot, and summary statistics are shown below.
Estimate the linear regression model that relates the response variable (monthly sales) to the predictor variable (price per kilogram).
a. Find the slope of the regression line.
b. Find the intercept of the regression line.
c. Write the equation of the linear model.
Unlock Deck
Unlock for access to all 32 flashcards in this deck.
Unlock Deck
k this deck
17
Consider the following to answer the question(s) below:
A small independent organic food store offers a variety of specialty coffees. To determine whether price has an impact on sales, the managers kept track of how many kilograms of each variety of coffee were sold last month. The data, scatterplot, and summary statistics are shown below.
Comment on whether each of the following conditions for correlation / linear regression is met.
a. Quantitative variable condition.
b. Linearity condition.
c. Outlier condition.
Unlock Deck
Unlock for access to all 32 flashcards in this deck.
Unlock Deck
k this deck
18
Consider the following to answer the question(s) below:
To determine whether the cash bonuses paid by Johnson Financial Group are related to annual pay, data were gathered for 10 account executives who received such bonuses in 2007. The data, scatterplot and summary statistics are shown below.
Comment on whether each of the following conditions for correlation / linear regression is met.
a. Quantitative variable condition.
b. Linearity condition.
c. Outlier condition.
Unlock Deck
Unlock for access to all 32 flashcards in this deck.
Unlock Deck
k this deck
19
Consider the following to answer the question(s) below:
To determine whether the cash bonuses paid by Johnson Financial Group are related to annual pay, data were gathered for 10 account executives who received such bonuses in 2007. The data, scatterplot and summary statistics are shown below.
What percent of the variability in cash bonuses can be explained by pay?
A) 100%
B) 85%
C) 73%
D) 30%
E) 54%
Unlock Deck
Unlock for access to all 32 flashcards in this deck.
Unlock Deck
k this deck
20
Consider the following to answer the question(s) below:
To determine whether the cash bonuses paid by Johnson Financial Group are related to annual pay, data were gathered for 10 account executives who received such bonuses in 2007. The data, scatterplot and summary statistics are shown below.
Based on the estimated regression line, the cash bonus for an executive at Johnson Financial earning $82, 613 a year would be
A) $11,863
B) $16,844
C) $27,682
D) $4,958
E) $15,819
Unlock Deck
Unlock for access to all 32 flashcards in this deck.
Unlock Deck
k this deck
21
Consider the following to answer the question(s) below:
A small independent organic food store offers a variety of specialty coffees. To determine whether price has an impact on sales, the managers kept track of how many kilograms of each variety of coffee were sold last month. The data, scatterplot and summary statistics are shown below.
Below is a plot showing residuals versus fitted values for the estimated regression equation relating monthly sales of coffee to price per kilogram. Based on this plot we can say
A) The linearity condition is not satisfied.
B) The linearity condition is reasonably satisfied.
C) A slight thickening of the plot is definitely not evident.
D) The correlation coefficient is close to one.
E) Nothing related to regression analysis can be said based on this graph.
Unlock Deck
Unlock for access to all 32 flashcards in this deck.
Unlock Deck
k this deck
22
Consider the following to answer the question(s) below:
A small independent organic food store offers a variety of specialty coffees. To determine whether price has an impact on sales, the managers kept track of how many kilograms of each variety of coffee were sold last month. The data, scatterplot and summary statistics are shown below.
A regression on a pair of variables, x and y, results in the value of R2 equal to 0.7834. Which of the following statements is true?
A) The correlation between x and y must be 0.7834.
B) The correlation between x and y must be -0.8851.
C) The correlation between x and y must be -0.7834.
D) The correlation between x and y must be either 0.8851 or -0.8851.
E) The correlation between x and y must be 0.8851.
Unlock Deck
Unlock for access to all 32 flashcards in this deck.
Unlock Deck
k this deck
23
Consider the following to answer the question(s) below:
To determine whether the tip left at the end of a meal is related to the size of the total bill at their restaurant, Chez Michelle, data were gathered for 10 customers. The data and summary statistics are shown below.
The residual for the estimated tip for a total bill of $120 would be
A) $5.13
B) $19.00
C) 0
D) -$11.45
E) $9.38
Unlock Deck
Unlock for access to all 32 flashcards in this deck.
Unlock Deck
k this deck
24
Consider the following to answer the question(s) below:
To determine whether the tip left at the end of a meal is related to the size of the total bill at their restaurant, Chez Michelle, data were gathered for 10 customers. The data and summary statistics are shown below.
The slope of the estimated regression line that relates the response variable (tip) to the predictor variable (total bill) is
A) 0.2128
B) -0.2128
C) 0.8773
D) 0.9366
E) -0.9367
Unlock Deck
Unlock for access to all 32 flashcards in this deck.
Unlock Deck
k this deck
25
Consider the following to answer the question(s) below:
To determine whether the tip left at the end of a meal is related to the size of the total bill at their restaurant, Chez Michelle, data were gathered for 10 customers. The data and summary statistics are shown below.
Which of the following is a correct interpretation for the regression slope coefficient b1?
A) The average change in y of a one-unit change in x will be b1 units.
B) For a one-unit change in y, we can expect the value of the independent variable to change by b1 units on average.
C) For each unit change in x, the dependent variable will change by b1 units.
D) The average change in x of a one-unit change in y will be b1 units.
E) The change in y of a one-unit change in x will always be b1 units.
Unlock Deck
Unlock for access to all 32 flashcards in this deck.
Unlock Deck
k this deck
26
Consider the following to answer the question(s) below:
To determine whether the tip left at the end of a meal is related to the size of the total bill at their restaurant, Chez Michelle, data were gathered for 10 customers. The data and summary statistics are shown below.
A manufacturing company is interested in predicting the number of defects (y) that will be produced each hour on the assembly line (x). Using sample data they estimate the equation as defects = 5.67 + 0.048 (hours). Which of the following statements is true?
A) The correlation between x and y is positive.
B) 4.8% of the variability in y is explained by x.
C) 23.08% of the variability in y is explained by x.
D) An increase in x of one-unit will result in an average increase of 5.67 in y.
E) The relationship between x and y could be either positive or negative.
Unlock Deck
Unlock for access to all 32 flashcards in this deck.
Unlock Deck
k this deck
27
Consider the following to answer the question(s) below:
To determine whether the tip left at the end of a meal is related to the size of the total bill at their restaurant, Chez Michelle, data were gathered for 10 customers. The data and summary statistics are shown below.
The percentage of the variability in tips that can be explained by the total bill is
A) 87.7%
B) 93.7%
C) 21.3%
D) 66.8%
E) 96.8%
Unlock Deck
Unlock for access to all 32 flashcards in this deck.
Unlock Deck
k this deck
28
Consider the following to answer the question(s) below:
To determine whether the tip left at the end of a meal is related to the size of the total bill at their restaurant, Chez Michelle, data were gathered for 10 customers. The data and summary statistics are shown below.
The intercept of the estimated regression line that relates the response variable (tip) to the predictor variable (total bill) is
A) -0.6684
B) 57.42
C) 0.6684
D) 0.5950
E) none of these
Unlock Deck
Unlock for access to all 32 flashcards in this deck.
Unlock Deck
k this deck
29
Consider the following to answer the question(s) below:
To determine whether the tip left at the end of a meal is related to the size of the total bill at their restaurant, Chez Michelle, data were gathered for 10 customers. The data and summary statistics are shown below.
The regression equation would predict what size of tip if the total bill was $120?
A) $24.87
B) $15.55
C) $26.03
D) $30.00
E) $20.62
Unlock Deck
Unlock for access to all 32 flashcards in this deck.
Unlock Deck
k this deck
30
Consider the following to answer the question(s) below:
To determine whether the tip left at the end of a meal is related to the size of the total bill at their restaurant, Chez Michelle, data were gathered for 10 customers. The data and summary statistics are shown below.
If a residual plot exhibits a curved pattern in the residuals, this means that
A) The relationship between x and y is also curved.
B) The residuals are not normally distributed.
C) x and y are positively correlated.
D) The residuals have a constant variance.
E) The relationship between x and y is linear.
Unlock Deck
Unlock for access to all 32 flashcards in this deck.
Unlock Deck
k this deck
31
Consider the following to answer the question(s) below:
A small independent organic food store offers a variety of specialty coffees. To determine whether price has an impact on sales, the managers kept track of how many kilograms of each variety of coffee were sold last month. The data, scatterplot and summary statistics are shown below.
What percent of the variability in the number of kilograms of coffee sold per month can be explained by price?
A) 95.47%
B) 100%
C) 85.8%
D) 55.6%
E) 4.68%
Unlock Deck
Unlock for access to all 32 flashcards in this deck.
Unlock Deck
k this deck
32
Consider the following to answer the question(s) below:
A small independent organic food store offers a variety of specialty coffees. To determine whether price has an impact on sales, the managers kept track of how many kilograms of each variety of coffee were sold last month. The data, scatterplot and summary statistics are shown below.
A pair of variables, x and y, have a correlation coefficient of -0.8851. Which of the following statements is true?
A) x explains about 78.34 percent of the variation in y.
B) x explains about 88.51 percent of the variation in y.
C) y explains about 78.34 percent of the variation in x.
D) x cannot explain about 78.34 percent of the variation in y.
E) y explains about 88.51 percent of the variation in x.
Unlock Deck
Unlock for access to all 32 flashcards in this deck.
Unlock Deck
k this deck
Unlock Deck
Unlock for access to all 32 flashcards in this deck.


