Deck 21: Building Multiple Regression Models
Full screen (f)
Question
Consider the following to answer the question(s) below:
A sample of 30 companies was randomly selected for a study investigating what factors affect the size of company bonuses. Data were collected on the number of employees at the company and whether or not the employees were unionized (1 = yes, 0 = no). The following multiple regression model was fit to the data.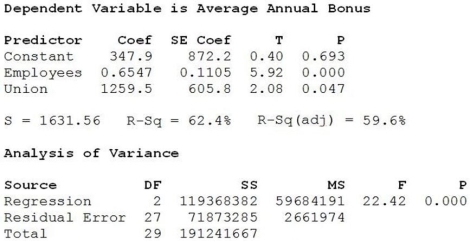
The correct interpretation of the regression coefficient of Union is
A) that the annual average bonus is $605.80 less for unionized companies compared to non-unionized companies of the same size (same number of employees).
B) that the annual average bonus is $605.80 more for unionized companies compared to non-unionized companies of the same size (same number of employees).
C) that the annual average bonus is $1259.50 less for unionized companies compared to non-unionized companies of the same size (same number of employees).
D) that the annual average bonus is $1259.50 more for unionized companies compared to non-unionized companies of the same size (same number of employees).
E) that the annual average bonus is $208 more for unionized companies compared to non-unionized companies of the same size (same number of employees).
Question
A sample of 30 companies was randomly selected for a study investigating what factors affect the size of company bonuses. Data were collected on the number of employees at the company and whether or not the employees were unionized (1 = yes, 0 = no). Below are the multiple regression results. 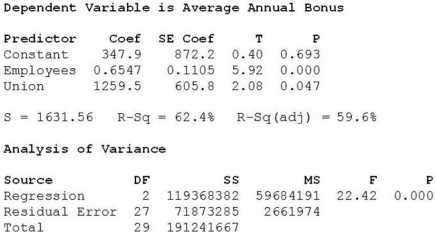 a. Write out the estimated regression equation.
b. Are all of the independent variables significant in this regression equation (using α = 0 .05)? Explain.
c. Interpret the coefficient of the Union.
d. Based on the scatterplot below, do you think using Union as an indicator variable in this model is appropriate? Explain.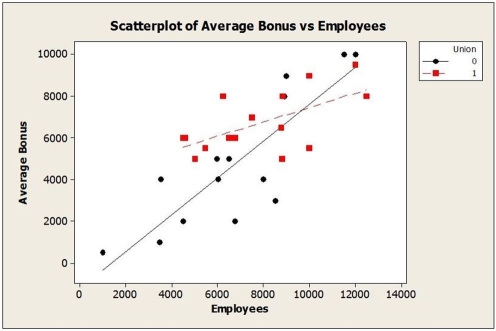 e. An alternative multiple regression model is fit to these data and the results are shown below. Which model is better? Explain.
 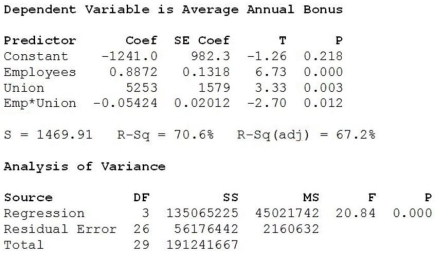 f. Using the better model, predict the annual average bonus for a company with 7500 employees that are not unionized.
a. Write out the estimated regression equation.b. Are all of the independent variables significant in this regression equation (using α = 0 .05)? Explain.
c. Interpret the coefficient of the Union.
d. Based on the scatterplot below, do you think using Union as an indicator variable in this model is appropriate? Explain.
e. An alternative multiple regression model is fit to these data and the results are shown below. Which model is better? Explain. f. Using the better model, predict the annual average bonus for a company with 7500 employees that are not unionized. Question
Consider the following to answer the question(s) below:
A sample of firms was selected from the high tech industry (Industry = 1) and the financial services sector (Industry = 0). Data were collected on the following variables: turnover rate, job growth, number of employees, and innovative index (higher scores indicate a more innovative and creative organizational culture). Below are the multiple regression results.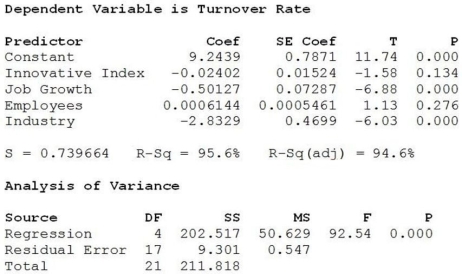
Which of the following independent variables are significant in this regression equation at α = 0.05?
A) Only Innovative Index
B) Only Employees
C) Both Innovative Index and Employees
D) Only Job Growth
E) Both Job Growth and Industry
Question
A sample of firms was selected from the high tech industry (Industry = 1) and the financial services sector (Industry = 0). Data were collected on the following variables: turnover rate, job growth, number of employees, and innovative index (higher scores indicate a more innovative and creative organizational culture). Below are the multiple regression results. 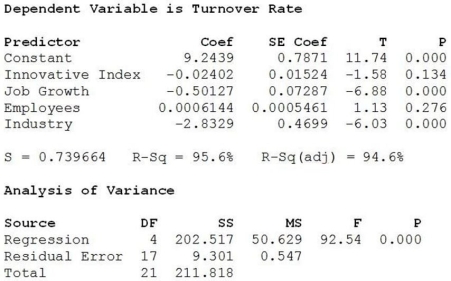 a. Write out the estimated regression equation.
b. Are all of the independent variables significant in this regression equation (using α = 0.05)? Explain.
c. Interpret the coefficient of the Industry.
d. An alternative multiple regression model is fit to these data and the results are shown below. Which model is better? Explain.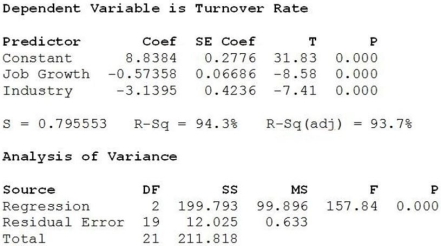 e. Based on the scatterplot below, is it appropriate to use Industry as an indicator variable in this regression model? Explain.
 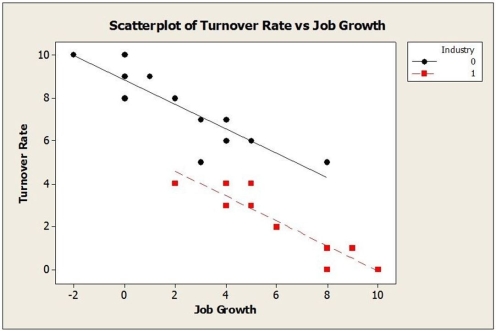 f. Using the better model, predict turnover rate for a firm in the financial services sector with 1000 employees, an innovative index of 50 and 2% job growth rate.
a. Write out the estimated regression equation.b. Are all of the independent variables significant in this regression equation (using α = 0.05)? Explain.
c. Interpret the coefficient of the Industry.
d. An alternative multiple regression model is fit to these data and the results are shown below. Which model is better? Explain.
e. Based on the scatterplot below, is it appropriate to use Industry as an indicator variable in this regression model? Explain. f. Using the better model, predict turnover rate for a firm in the financial services sector with 1000 employees, an innovative index of 50 and 2% job growth rate. Question
Consider the following to answer the question(s) below:
An alternative multiple regression model is fit to the data on the sample of firms selected from the high tech industry (Industry = 1) and the financial services sector (Industry = 0). The results are shown below.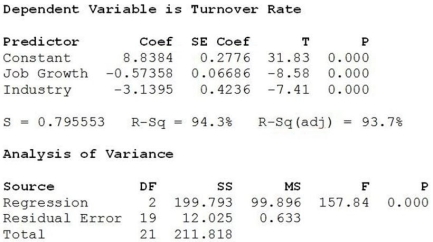
What does the scatterplot of these data (shown below) suggest?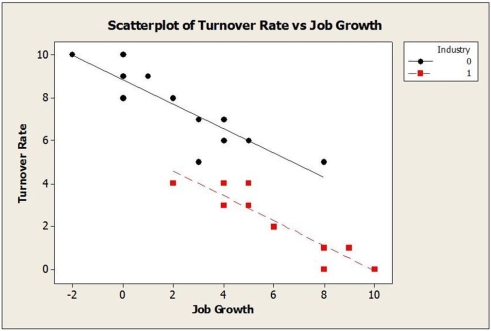
A) Using Job Growth as an indicator variable in this model is appropriate.
B) Using the interaction term Job Growth×Industry in the model is appropriate.
C) Using Industry as an indicator variable in this model is appropriate.
D) Job Growth should not be included in the model as a variable.
E) Using Industry as an indicator variable in this model is definitely not appropriate.
Question
Question
Question
Consider the following to answer the question(s) below:
A sample of 30 companies was randomly selected for a study investigating what factors affect the size of company bonuses. Data were collected on the number of employees at the company and whether or not the employees were unionized (1 = yes, 0 = no). The following multiple regression model was fit to the data.
Which of the following statements is not true at α = 0.05?
A) The multiple regression model is overall significant in explaining the size of company bonuses.
B) The number of employees at the company is a significant variable in explaining the size of company bonuses.
C) Whether or not the employees are unionized is a significant variable in explaining the size of company bonuses.
D) The regression model accounts for 62.4% of the variation in average annual bonus.
E) The regression model only accounts for 59.6% of the variation in average annual bonus because Employees is not significant variable.
Question
Question
Consider the following to answer the question(s) below:
A Toronto accounting firm estimated a model to explain variation in client profitability. The dependent variable is client net profits and the predictor variables include the hours spent working on the client and indicator variables to denote the type of client-manufacturing, service, or government. The indicator variables have a value of one if the client is the type described. The following are the model results.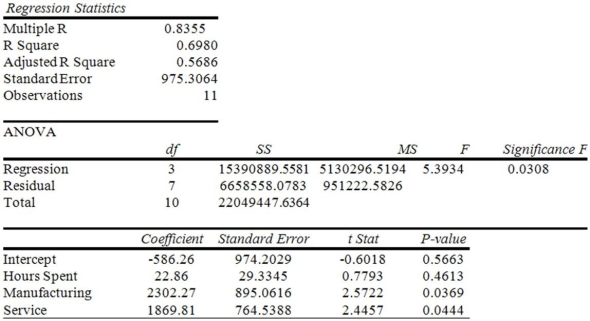
If the number of hours spent on a client is 100, and the client is in the Service industry, what is the predicted net profit?
A) The predicted net profit is $3,569.55.
B) The predicted net profit is $1,869.81.
C) The predicted net profit is $1,283.55.
D) The predicted net profit is $4,172.08.
E) The predicted net profit is $3,585.82.
Question
Question
Consider the following to answer the question(s) below:
A regression equation that predicts the price of homes in thousands of dollars is = 24.6 + 0.055x1, where x1 is a variable that represents the assessed value of the house and x2 is an indicator variable that represents whether the house is on a busy street (1 = yes, 0 = no).
The regression model mentioned above resulted in a high R2 and large F, but individual t-statistics were not significant. Which of the following statements is true?
A) We would suspect homoscedasticity in the model.
B) We would suspect autocorrelation in the model.
C) We would suspect collinearity in the model.
D) We would suspect that the model contains influential points.
E) We would suspect that the model contains high-leverage points.
A regression equation that predicts the price of homes in thousands of dollars is
= 24.6 + 0.055x1, where x1 is a variable that represents the assessed value of the house and x2 is an indicator variable that represents whether the house is on a busy street (1 = yes, 0 = no).The regression model mentioned above resulted in a high R2 and large F, but individual t-statistics were not significant. Which of the following statements is true?
A) We would suspect homoscedasticity in the model.
B) We would suspect autocorrelation in the model.
C) We would suspect collinearity in the model.
D) We would suspect that the model contains influential points.
E) We would suspect that the model contains high-leverage points.
Question
Consider the following to answer the question(s) below:
A sample of firms was selected from the high tech industry (Industry = 1) and the financial services sector (Industry = 0). Data were collected on the following variables: turnover rate, job growth, number of employees, and innovative index (higher scores indicate a more innovative and creative organizational culture). Below are the multiple regression results.
How much of the variability in Turnover Rate is explained by the multiple regression model?
A) 73.9%
B) 95.6%
C) 9.3%
D) 50.62%
E) 91.39%
Question
Consider the following to answer the question(s) below:
A regression equation that predicts the price of homes in thousands of dollars is = 24.6 + 0.055x1, where x1 is a variable that represents the assessed value of the house and x2 is an indicator variable that represents whether the house is on a busy street (1 = yes, 0 = no).
Based on this information, which of the following statements is true?
A) On average, homes with the same assessed value that are on busy streets are worth $3600 less than homes that are not on busy streets.
B) For a given assessed value, on average, homes that are on busy streets are worth $360 less than homes that are not on busy streets.
C) For a given assessed value, on average, homes that are on busy streets are worth $3600 more than homes that are not on busy streets.
D) On average, homes with the same assessed value that are on busy streets are worth $360 more than homes that are not on busy streets.
E) For a given assessed value, on average, homes that are on busy streets are worth 24.6 - 3.6 = $19000 less than homes that are not on busy streets.
A regression equation that predicts the price of homes in thousands of dollars is
= 24.6 + 0.055x1, where x1 is a variable that represents the assessed value of the house and x2 is an indicator variable that represents whether the house is on a busy street (1 = yes, 0 = no).Based on this information, which of the following statements is true?
A) On average, homes with the same assessed value that are on busy streets are worth $3600 less than homes that are not on busy streets.
B) For a given assessed value, on average, homes that are on busy streets are worth $360 less than homes that are not on busy streets.
C) For a given assessed value, on average, homes that are on busy streets are worth $3600 more than homes that are not on busy streets.
D) On average, homes with the same assessed value that are on busy streets are worth $360 more than homes that are not on busy streets.
E) For a given assessed value, on average, homes that are on busy streets are worth 24.6 - 3.6 = $19000 less than homes that are not on busy streets.
Question
Consider the following to answer the question(s) below:
A sample of 30 companies was randomly selected for a study investigating what factors affect the size of company bonuses. Data were collected on the number of employees at the company and whether or not the employees were unionized (1 = yes, 0 = no). The following multiple regression model was fit to the data.
The estimated regression model is
A) Average Annual Bonus = 347.9 + 0.6547 Employees + 1259.5 Union.
B) Average Annual Bonus = 872.2 + 0.1105 Employees + 605.8 Union.
C) Average Annual Bonus = 0.40 + 8.92 Employees + 2.08 Union.
D) Average Annual Bonus = 0.6547 Employees + 1259.5 Union.
E) Average Annual Bonus = 347.9 + 872.2 Employees + 0.40 Union.
Question
Consider the following to answer the question(s) below:
A sample of 30 companies was randomly selected for a study investigating what factors affect the size of company bonuses. Data were collected on the number of employees at the company and whether or not the employees were unionized (1 = yes, 0 = no). The following multiple regression model was fit to the data.
What does the scatterplot of these data (shown below) suggest?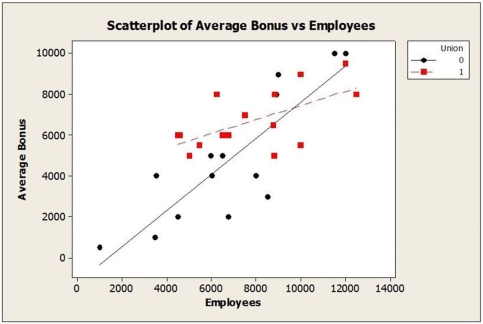
A) Using the interaction term Employees×Union rather than the indicator variable Union in the model might be more appropriate.
B) The intersection of the line confirms that using Union as an indicator variable in this model is appropriate.
C) The intersection of the line suggests that Union should not be included in the model as a variable.
D) The intersection of the line suggests that Employees should not be included in the model as a variable.
E) Using the interaction term Employees×Union in the model is definitely inappropriate.
Question
Question
Consider the following to answer the question(s) below:
An alternative multiple regression model is fit to the data on the sample of firms selected from the high tech industry (Industry = 1) and the financial services sector (Industry = 0). The results are shown below.
Which of the following statements is true?
A) All of the independent variables in this model are significant.
B) The dependent variable is the type of industry.
C) This model does not include an indicator variable.
D) Job Growth is a significant variable, but Industry is not.
E) The regression model is not overall significant.
Question
Consider the following to answer the question(s) below:
A sample of firms was selected from the high tech industry (Industry = 1) and the financial services sector (Industry = 0). Data were collected on the following variables: turnover rate, job growth, number of employees, and innovative index (higher scores indicate a more innovative and creative organizational culture). Below are the multiple regression results.
Which statement is true about the estimated multiple regression model?
A) Turnover rate is the indicator variable.
B) Innovative index is the indicator variable.
C) Test results indicate that the model is overall significant in explaining Turnover rate.
D) F test results indicate that the model is not significant in explaining Turnover rate.
E) The coefficients associated with Job Growth and Industry variables are not significantly different from zero.
Question
Question
The editors of a national automotive magazine recently studied 30 different automobiles sold in the Canada with the intent of seeing whether they could develop a multiple regression model to explain the variation in highway fuel consumption. A number of different independent variables were collected. Included in these were two variables described as follows: 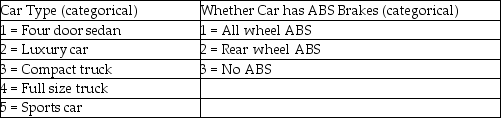 If these two variables are to be included in a regression model, how many additional indicator variables will be needed?
A) 6
B) 8
C) 2
D) 4
E) 5
If these two variables are to be included in a regression model, how many additional indicator variables will be needed?A) 6
B) 8
C) 2
D) 4
E) 5
Question
Consider the following to answer the question(s) below:
A Toronto accounting firm estimated a model to explain variation in client profitability. The dependent variable is client net profits and the predictor variables include the hours spent working on the client and indicator variables to denote the type of client-manufacturing, service, or government. The indicator variables have a value of one if the client is the type described. The following are the model results.
At α = 0.05, which of the following statements is not correct?
A) The overall regression model is significant in explaining net profits.
B) The number of hours spent on a client is not significant in explaining variation in client profitability.
C) The indicator variables for client type are significant in explaining variation in client profitability.
D) The regression model explains about 70% of the variation in client profitability.
E) The number of hours spent on a client is significant in explaining variation in client profitability.

Unlock Deck
Sign up to unlock the cards in this deck!
Unlock Deck
Unlock Deck
1/22
Play
Full screen (f)
Deck 21: Building Multiple Regression Models
1
Consider the following to answer the question(s) below:
A sample of 30 companies was randomly selected for a study investigating what factors affect the size of company bonuses. Data were collected on the number of employees at the company and whether or not the employees were unionized (1 = yes, 0 = no). The following multiple regression model was fit to the data.
The correct interpretation of the regression coefficient of Union is
A) that the annual average bonus is $605.80 less for unionized companies compared to non-unionized companies of the same size (same number of employees).
B) that the annual average bonus is $605.80 more for unionized companies compared to non-unionized companies of the same size (same number of employees).
C) that the annual average bonus is $1259.50 less for unionized companies compared to non-unionized companies of the same size (same number of employees).
D) that the annual average bonus is $1259.50 more for unionized companies compared to non-unionized companies of the same size (same number of employees).
E) that the annual average bonus is $208 more for unionized companies compared to non-unionized companies of the same size (same number of employees).
that the annual average bonus is $1259.50 more for unionized companies compared to non-unionized companies of the same size (same number of employees).
2
A sample of 30 companies was randomly selected for a study investigating what factors affect the size of company bonuses. Data were collected on the number of employees at the company and whether or not the employees were unionized (1 = yes, 0 = no). Below are the multiple regression results. a. Write out the estimated regression equation.
b. Are all of the independent variables significant in this regression equation (using α = 0 .05)? Explain.
c. Interpret the coefficient of the Union.
d. Based on the scatterplot below, do you think using Union as an indicator variable in this model is appropriate? Explain. e. An alternative multiple regression model is fit to these data and the results are shown below. Which model is better? Explain. f. Using the better model, predict the annual average bonus for a company with 7500 employees that are not unionized.
a. Write out the estimated regression equation.b. Are all of the independent variables significant in this regression equation (using α = 0 .05)? Explain.
c. Interpret the coefficient of the Union.
d. Based on the scatterplot below, do you think using Union as an indicator variable in this model is appropriate? Explain.
e. An alternative multiple regression model is fit to these data and the results are shown below. Which model is better? Explain. f. Using the better model, predict the annual average bonus for a company with 7500 employees that are not unionized.a. The regression equation is Average Annual Bonus = 347.9 + 0.6547 Employees + 1259.5 Union.
b. Yes, the P-value associated with each t-statistic for the regression coefficients of Employees and Union is less than 0.05, therefore in each case we reject the null hypothesis. We can conclude that the regression coefficients associated with these two independent variables are significantly different from zero.
c. The estimated regression coefficient for Union is 1259.5. This means that the annual average bonus is $1259.5 more for unionized companies compared to non-unionized companies of the same size (same number of employees).
d. The scatterplot shows that if we consider unionized and non-unionized companies separately, we see two different slopes (the lines are not parallel). This indicates that an interaction term Employees×Union rather than the indicator variable Union might be more appropriate.
e. This second model is better. All independent variables (including the interaction term) are significant. It has a higher R2 and R2Adj than the first model. It has a smaller S than the first model as well.
f. The predicted value is $5413.
3
Consider the following to answer the question(s) below:
A sample of firms was selected from the high tech industry (Industry = 1) and the financial services sector (Industry = 0). Data were collected on the following variables: turnover rate, job growth, number of employees, and innovative index (higher scores indicate a more innovative and creative organizational culture). Below are the multiple regression results.
Which of the following independent variables are significant in this regression equation at α = 0.05?
A) Only Innovative Index
B) Only Employees
C) Both Innovative Index and Employees
D) Only Job Growth
E) Both Job Growth and Industry
Both Job Growth and Industry
4
A sample of firms was selected from the high tech industry (Industry = 1) and the financial services sector (Industry = 0). Data were collected on the following variables: turnover rate, job growth, number of employees, and innovative index (higher scores indicate a more innovative and creative organizational culture). Below are the multiple regression results. a. Write out the estimated regression equation.
b. Are all of the independent variables significant in this regression equation (using α = 0.05)? Explain.
c. Interpret the coefficient of the Industry.
d. An alternative multiple regression model is fit to these data and the results are shown below. Which model is better? Explain. e. Based on the scatterplot below, is it appropriate to use Industry as an indicator variable in this regression model? Explain. f. Using the better model, predict turnover rate for a firm in the financial services sector with 1000 employees, an innovative index of 50 and 2% job growth rate.
a. Write out the estimated regression equation.b. Are all of the independent variables significant in this regression equation (using α = 0.05)? Explain.
c. Interpret the coefficient of the Industry.
d. An alternative multiple regression model is fit to these data and the results are shown below. Which model is better? Explain.
e. Based on the scatterplot below, is it appropriate to use Industry as an indicator variable in this regression model? Explain. f. Using the better model, predict turnover rate for a firm in the financial services sector with 1000 employees, an innovative index of 50 and 2% job growth rate. Unlock Deck
Unlock for access to all 22 flashcards in this deck.
Unlock Deck
k this deck
5
Consider the following to answer the question(s) below:
An alternative multiple regression model is fit to the data on the sample of firms selected from the high tech industry (Industry = 1) and the financial services sector (Industry = 0). The results are shown below.
What does the scatterplot of these data (shown below) suggest?
A) Using Job Growth as an indicator variable in this model is appropriate.
B) Using the interaction term Job Growth×Industry in the model is appropriate.
C) Using Industry as an indicator variable in this model is appropriate.
D) Job Growth should not be included in the model as a variable.
E) Using Industry as an indicator variable in this model is definitely not appropriate.
Unlock Deck
Unlock for access to all 22 flashcards in this deck.
Unlock Deck
k this deck
6
Which of the following statements describing the consequences of collinearity in a model is not true?
A) The value of the Variance Inflation Factor will be high.
B) An estimated coefficient may have an unexpected sign or size being large or small.
C) The F-statistic for the model may indicate overall significance, but most or all of the individual coefficients have t-statistics showing insignificance.
D) Collinearity occurs when two or more predictor variables are correlated.
E) When a predictor is collinear with the other predictors in the model, the standard error of its coefficient is always small and t-statistic always large.
Unlock Deck
Unlock for access to all 22 flashcards in this deck.
Unlock Deck
k this deck
7
Using this model, the predicted turnover rate for a firm in the financial services sector with 1000 employees, an innovativeness index of 50, and 2% job growth rate is
A) 8.25%.
B) 7.69%.
C) 4.56%.
D) 6.19%.
E) 37.41%.
A) 8.25%.
B) 7.69%.
C) 4.56%.
D) 6.19%.
E) 37.41%.
Unlock Deck
Unlock for access to all 22 flashcards in this deck.
Unlock Deck
k this deck
8
Consider the following to answer the question(s) below:
A sample of 30 companies was randomly selected for a study investigating what factors affect the size of company bonuses. Data were collected on the number of employees at the company and whether or not the employees were unionized (1 = yes, 0 = no). The following multiple regression model was fit to the data.
Which of the following statements is not true at α = 0.05?
A) The multiple regression model is overall significant in explaining the size of company bonuses.
B) The number of employees at the company is a significant variable in explaining the size of company bonuses.
C) Whether or not the employees are unionized is a significant variable in explaining the size of company bonuses.
D) The regression model accounts for 62.4% of the variation in average annual bonus.
E) The regression model only accounts for 59.6% of the variation in average annual bonus because Employees is not significant variable.
Unlock Deck
Unlock for access to all 22 flashcards in this deck.
Unlock Deck
k this deck
9
Which of the following statements does not describe a point with high leverage?
A) A point may exert high leverage because it has an unusual combination of predictor values.
B) A point with high leverage is easy to see in a regression of a single predictor and response.
C) A point of high leverage may not influence the regression slope.
D) A point with zero leverage has no effect on the regression slope.
E) The leverage can be negative.
Unlock Deck
Unlock for access to all 22 flashcards in this deck.
Unlock Deck
k this deck
10
Consider the following to answer the question(s) below:
A Toronto accounting firm estimated a model to explain variation in client profitability. The dependent variable is client net profits and the predictor variables include the hours spent working on the client and indicator variables to denote the type of client-manufacturing, service, or government. The indicator variables have a value of one if the client is the type described. The following are the model results.
If the number of hours spent on a client is 100, and the client is in the Service industry, what is the predicted net profit?
A) The predicted net profit is $3,569.55.
B) The predicted net profit is $1,869.81.
C) The predicted net profit is $1,283.55.
D) The predicted net profit is $4,172.08.
E) The predicted net profit is $3,585.82.
Unlock Deck
Unlock for access to all 22 flashcards in this deck.
Unlock Deck
k this deck
11
Trying to estimate possible collinearity in the regression model we should use
A) Leverage Index.
B) Variance Inflation Factor.
C) Determination Coefficient.
D) Standardized Residual.
E) Cook's Distance.
A) Leverage Index.
B) Variance Inflation Factor.
C) Determination Coefficient.
D) Standardized Residual.
E) Cook's Distance.
Unlock Deck
Unlock for access to all 22 flashcards in this deck.
Unlock Deck
k this deck
12
Consider the following to answer the question(s) below:
A regression equation that predicts the price of homes in thousands of dollars is = 24.6 + 0.055x1, where x1 is a variable that represents the assessed value of the house and x2 is an indicator variable that represents whether the house is on a busy street (1 = yes, 0 = no).
The regression model mentioned above resulted in a high R2 and large F, but individual t-statistics were not significant. Which of the following statements is true?
A) We would suspect homoscedasticity in the model.
B) We would suspect autocorrelation in the model.
C) We would suspect collinearity in the model.
D) We would suspect that the model contains influential points.
E) We would suspect that the model contains high-leverage points.
A regression equation that predicts the price of homes in thousands of dollars is
= 24.6 + 0.055x1, where x1 is a variable that represents the assessed value of the house and x2 is an indicator variable that represents whether the house is on a busy street (1 = yes, 0 = no).The regression model mentioned above resulted in a high R2 and large F, but individual t-statistics were not significant. Which of the following statements is true?
A) We would suspect homoscedasticity in the model.
B) We would suspect autocorrelation in the model.
C) We would suspect collinearity in the model.
D) We would suspect that the model contains influential points.
E) We would suspect that the model contains high-leverage points.
Unlock Deck
Unlock for access to all 22 flashcards in this deck.
Unlock Deck
k this deck
13
Consider the following to answer the question(s) below:
A sample of firms was selected from the high tech industry (Industry = 1) and the financial services sector (Industry = 0). Data were collected on the following variables: turnover rate, job growth, number of employees, and innovative index (higher scores indicate a more innovative and creative organizational culture). Below are the multiple regression results.
How much of the variability in Turnover Rate is explained by the multiple regression model?
A) 73.9%
B) 95.6%
C) 9.3%
D) 50.62%
E) 91.39%
Unlock Deck
Unlock for access to all 22 flashcards in this deck.
Unlock Deck
k this deck
14
Consider the following to answer the question(s) below:
A regression equation that predicts the price of homes in thousands of dollars is = 24.6 + 0.055x1, where x1 is a variable that represents the assessed value of the house and x2 is an indicator variable that represents whether the house is on a busy street (1 = yes, 0 = no).
Based on this information, which of the following statements is true?
A) On average, homes with the same assessed value that are on busy streets are worth $3600 less than homes that are not on busy streets.
B) For a given assessed value, on average, homes that are on busy streets are worth $360 less than homes that are not on busy streets.
C) For a given assessed value, on average, homes that are on busy streets are worth $3600 more than homes that are not on busy streets.
D) On average, homes with the same assessed value that are on busy streets are worth $360 more than homes that are not on busy streets.
E) For a given assessed value, on average, homes that are on busy streets are worth 24.6 - 3.6 = $19000 less than homes that are not on busy streets.
A regression equation that predicts the price of homes in thousands of dollars is
= 24.6 + 0.055x1, where x1 is a variable that represents the assessed value of the house and x2 is an indicator variable that represents whether the house is on a busy street (1 = yes, 0 = no).Based on this information, which of the following statements is true?
A) On average, homes with the same assessed value that are on busy streets are worth $3600 less than homes that are not on busy streets.
B) For a given assessed value, on average, homes that are on busy streets are worth $360 less than homes that are not on busy streets.
C) For a given assessed value, on average, homes that are on busy streets are worth $3600 more than homes that are not on busy streets.
D) On average, homes with the same assessed value that are on busy streets are worth $360 more than homes that are not on busy streets.
E) For a given assessed value, on average, homes that are on busy streets are worth 24.6 - 3.6 = $19000 less than homes that are not on busy streets.
Unlock Deck
Unlock for access to all 22 flashcards in this deck.
Unlock Deck
k this deck
15
Consider the following to answer the question(s) below:
A sample of 30 companies was randomly selected for a study investigating what factors affect the size of company bonuses. Data were collected on the number of employees at the company and whether or not the employees were unionized (1 = yes, 0 = no). The following multiple regression model was fit to the data.
The estimated regression model is
A) Average Annual Bonus = 347.9 + 0.6547 Employees + 1259.5 Union.
B) Average Annual Bonus = 872.2 + 0.1105 Employees + 605.8 Union.
C) Average Annual Bonus = 0.40 + 8.92 Employees + 2.08 Union.
D) Average Annual Bonus = 0.6547 Employees + 1259.5 Union.
E) Average Annual Bonus = 347.9 + 872.2 Employees + 0.40 Union.
Unlock Deck
Unlock for access to all 22 flashcards in this deck.
Unlock Deck
k this deck
16
Consider the following to answer the question(s) below:
A sample of 30 companies was randomly selected for a study investigating what factors affect the size of company bonuses. Data were collected on the number of employees at the company and whether or not the employees were unionized (1 = yes, 0 = no). The following multiple regression model was fit to the data.
What does the scatterplot of these data (shown below) suggest?
A) Using the interaction term Employees×Union rather than the indicator variable Union in the model might be more appropriate.
B) The intersection of the line confirms that using Union as an indicator variable in this model is appropriate.
C) The intersection of the line suggests that Union should not be included in the model as a variable.
D) The intersection of the line suggests that Employees should not be included in the model as a variable.
E) Using the interaction term Employees×Union in the model is definitely inappropriate.
Unlock Deck
Unlock for access to all 22 flashcards in this deck.
Unlock Deck
k this deck
17
Which of the following statements about multiple regression model building methods is true?
A) There is no simple definition of the "best" model in multiple regression analysis.
B) Stepwise selection will always find the best regression model.
C) Both stepwise and best subsets methods check assumptions and conditions.
D) The best subsets method will involve trying fewer different regression models than stepwise regression.
E) There is only one criterion (value of R2) that leads to the best model.
Unlock Deck
Unlock for access to all 22 flashcards in this deck.
Unlock Deck
k this deck
18
Consider the following to answer the question(s) below:
An alternative multiple regression model is fit to the data on the sample of firms selected from the high tech industry (Industry = 1) and the financial services sector (Industry = 0). The results are shown below.
Which of the following statements is true?
A) All of the independent variables in this model are significant.
B) The dependent variable is the type of industry.
C) This model does not include an indicator variable.
D) Job Growth is a significant variable, but Industry is not.
E) The regression model is not overall significant.
Unlock Deck
Unlock for access to all 22 flashcards in this deck.
Unlock Deck
k this deck
19
Consider the following to answer the question(s) below:
A sample of firms was selected from the high tech industry (Industry = 1) and the financial services sector (Industry = 0). Data were collected on the following variables: turnover rate, job growth, number of employees, and innovative index (higher scores indicate a more innovative and creative organizational culture). Below are the multiple regression results.
Which statement is true about the estimated multiple regression model?
A) Turnover rate is the indicator variable.
B) Innovative index is the indicator variable.
C) Test results indicate that the model is overall significant in explaining Turnover rate.
D) F test results indicate that the model is not significant in explaining Turnover rate.
E) The coefficients associated with Job Growth and Industry variables are not significantly different from zero.
Unlock Deck
Unlock for access to all 22 flashcards in this deck.
Unlock Deck
k this deck
20
Which of the following statements is true?
A) The method used in regression analysis for incorporating a categorical variable into the model is by organizing the categorical variable into one or more indicator variables.
B) An indicator variable is a dependent variable whose value is set at either zero or one.
C) There are four possible responses listed for marital status. Based on this, four indicator variables will need to be created and incorporated into the regression model.
D) On a survey there is a question that asks whether someone lives in a house, apartment, or condominium. These three responses could be coded in an indicator variable using values of 0, 1, and 2.
E) The scatterplot can show whether using an indicator variable in the model is appropriate. However, it gives no clue about using an interaction term.
Unlock Deck
Unlock for access to all 22 flashcards in this deck.
Unlock Deck
k this deck
21
The editors of a national automotive magazine recently studied 30 different automobiles sold in the Canada with the intent of seeing whether they could develop a multiple regression model to explain the variation in highway fuel consumption. A number of different independent variables were collected. Included in these were two variables described as follows: If these two variables are to be included in a regression model, how many additional indicator variables will be needed?
A) 6
B) 8
C) 2
D) 4
E) 5
If these two variables are to be included in a regression model, how many additional indicator variables will be needed?A) 6
B) 8
C) 2
D) 4
E) 5
Unlock Deck
Unlock for access to all 22 flashcards in this deck.
Unlock Deck
k this deck
22
Consider the following to answer the question(s) below:
A Toronto accounting firm estimated a model to explain variation in client profitability. The dependent variable is client net profits and the predictor variables include the hours spent working on the client and indicator variables to denote the type of client-manufacturing, service, or government. The indicator variables have a value of one if the client is the type described. The following are the model results.
At α = 0.05, which of the following statements is not correct?
A) The overall regression model is significant in explaining net profits.
B) The number of hours spent on a client is not significant in explaining variation in client profitability.
C) The indicator variables for client type are significant in explaining variation in client profitability.
D) The regression model explains about 70% of the variation in client profitability.
E) The number of hours spent on a client is significant in explaining variation in client profitability.
Unlock Deck
Unlock for access to all 22 flashcards in this deck.
Unlock Deck
k this deck
Unlock Deck
Unlock for access to all 22 flashcards in this deck.


