Deck 9: Control Charts for Attributes
Full screen (f)
Question
Question
Question
Question
Question
Question
Determine the revised central line for a count of nonconformities chart. Assume any out-of-control points have assignable causes. Data not shown are in control. The trial central line is 0.80, the trial UCL is 2.00, and the trial LCL is 0. 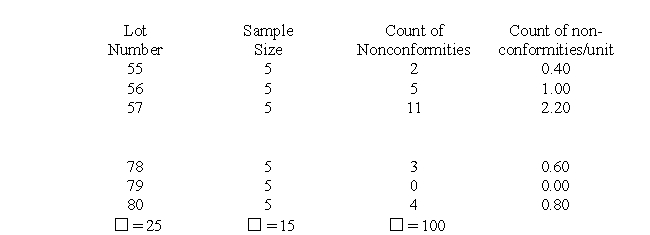
Question
Question
Question
Question
Question
Question
Determine the trial UCL for a fraction nonconforming chart for May 8 where the trial central line is 0.012. Is May 8 in control or out of control and why? 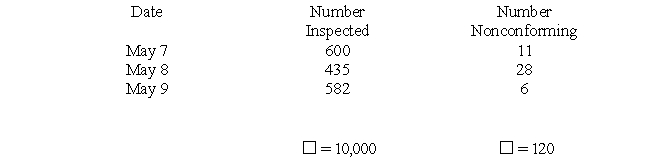
Question
Question
Question
Question

Unlock Deck
Sign up to unlock the cards in this deck!
Unlock Deck
Unlock Deck
1/16
Play
Full screen (f)
Deck 9: Control Charts for Attributes
1
When the lower limit of a c chart is less than zero:
A) change it to 0
B) recalculate; an error has been made
C)leave it alone
D)use a p chart
A) change it to 0
B) recalculate; an error has been made
C)leave it alone
D)use a p chart
change it to 0
2
Which of the following concerning the p chart is false?
A) it is a variable control chart
B) can give an overall quality picture
C) can be used for many characteristics
D) evaluates the CEO
A) it is a variable control chart
B) can give an overall quality picture
C) can be used for many characteristics
D) evaluates the CEO
A
3
A u chart measures:
A) the number of nonconforming units
B) the count of nonconformities
C) the number of standard deviations
D) the count of nonconformities/unit
A) the number of nonconforming units
B) the count of nonconformities
C) the number of standard deviations
D) the count of nonconformities/unit
D
4
Trial control limits are calculated based on at least:
A) 5 subgroups
B) 25 subgroups
C) 15 subgroups
D) 35 subgroups
A) 5 subgroups
B) 25 subgroups
C) 15 subgroups
D) 35 subgroups
Unlock Deck
Unlock for access to all 16 flashcards in this deck.
Unlock Deck
k this deck
5
Which of the following is not a purpose of p charts?
A) to discover the average quality level.
B) to discover low spots which may be due to erratic inspection or superior quality.
C) to suggest places to use X and R charts
D) none of the above
A) to discover the average quality level.
B) to discover low spots which may be due to erratic inspection or superior quality.
C) to suggest places to use X and R charts
D) none of the above
Unlock Deck
Unlock for access to all 16 flashcards in this deck.
Unlock Deck
k this deck
6
Determine the revised central line for a count of nonconformities chart. Assume any out-of-control points have assignable causes. Data not shown are in control. The trial central line is 0.80, the trial UCL is 2.00, and the trial LCL is 0.
Unlock Deck
Unlock for access to all 16 flashcards in this deck.
Unlock Deck
k this deck
7
A np chart is used for:
A) controlling the number of nonconformities of a product
B) controlling the fraction nonconforming in a lot
C) cases where there are few opportunities for a nonconformity to occur
D) controlling the number nonconforming of a product
A) controlling the number of nonconformities of a product
B) controlling the fraction nonconforming in a lot
C) cases where there are few opportunities for a nonconformity to occur
D) controlling the number nonconforming of a product
Unlock Deck
Unlock for access to all 16 flashcards in this deck.
Unlock Deck
k this deck
8
Determine the trial UCL and trial central line for a count of nonconformities chart for 25 subgroups where the sum of the count of nonconformities is 3827.
Unlock Deck
Unlock for access to all 16 flashcards in this deck.
Unlock Deck
k this deck
9
A fraction nonconforming chart is frequently converted to a percent nonconforming chart:
A) so that employees can understand it better
B) because of the difficulty of variable subgroup size
C) so that an average subgroup size (n) can be used
D) so that the lower control limit will be eliminated
A) so that employees can understand it better
B) because of the difficulty of variable subgroup size
C) so that an average subgroup size (n) can be used
D) so that the lower control limit will be eliminated
Unlock Deck
Unlock for access to all 16 flashcards in this deck.
Unlock Deck
k this deck
10
The severity problem of a quality characteristic can be minimized by:
A) an alert inspector
B) using two-sigma limits
C) demerit system
D) none of these
A) an alert inspector
B) using two-sigma limits
C) demerit system
D) none of these
Unlock Deck
Unlock for access to all 16 flashcards in this deck.
Unlock Deck
k this deck
11
The problem of variable subgroup size for a p chart can be minimized by:
A) using an average subgroup size
B) changing the product
C) changing the production process
D) none of these
A) using an average subgroup size
B) changing the product
C) changing the production process
D) none of these
Unlock Deck
Unlock for access to all 16 flashcards in this deck.
Unlock Deck
k this deck
12
Determine the trial UCL for a fraction nonconforming chart for May 8 where the trial central line is 0.012. Is May 8 in control or out of control and why?
Unlock Deck
Unlock for access to all 16 flashcards in this deck.
Unlock Deck
k this deck
13
A p chart is used for:
A) controlling the count of nonconformities in a product
B) controlling the fraction nonconforming
C) cases where there are few opportunities for nonconformities to occur
D) none of these
A) controlling the count of nonconformities in a product
B) controlling the fraction nonconforming
C) cases where there are few opportunities for nonconformities to occur
D) none of these
Unlock Deck
Unlock for access to all 16 flashcards in this deck.
Unlock Deck
k this deck
14
A process is in statistical control. Ninety-five pieces are inspected every day and the population percent nonconforming is 7.2%. What is the UCL of a number nonconforming chart?
Unlock Deck
Unlock for access to all 16 flashcards in this deck.
Unlock Deck
k this deck
15
Which of the following concerning the p chart is true:
A) applied to quality characteristics which are variables
B) gives a poor overall quality picture
C) can be used for many characteristics
D) all of the above
A) applied to quality characteristics which are variables
B) gives a poor overall quality picture
C) can be used for many characteristics
D) all of the above
Unlock Deck
Unlock for access to all 16 flashcards in this deck.
Unlock Deck
k this deck
16
The first five steps of the control chart process are for:
A) the operators
B) the supervisors
C) planning
D) action
A) the operators
B) the supervisors
C) planning
D) action
Unlock Deck
Unlock for access to all 16 flashcards in this deck.
Unlock Deck
k this deck
Unlock Deck
Unlock for access to all 16 flashcards in this deck.


