Deck 11: Two-Sample Tests of Hypothesis
Full screen (f)
Question
Question
A recent study focused on the number of times men and women send a Twitter message in a day. The information is summarized next. 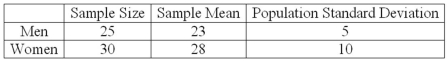 At the .01 significance level, is there a difference in the mean number of times men and women send a Twitter message in a day? What is the value of the test statistic for this hypothesis test?
A)2.668
B)2.672
C)2.58
D)2.40
At the .01 significance level, is there a difference in the mean number of times men and women send a Twitter message in a day? What is the value of the test statistic for this hypothesis test?A)2.668
B)2.672
C)2.58
D)2.40
Question
Question
Question
A recent study focused on the number of times men and women send a Twitter message in a day. The sample information is summarized below. 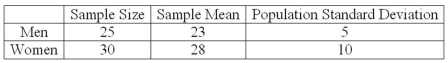 At the .01 significance level, is there a difference in the mean number of times men and women send a Twitter message in a day? What is the test statistic for this hypothesis?
A)z-statistic
B)t-statistic
C)p-statistic
D)df-statistic
At the .01 significance level, is there a difference in the mean number of times men and women send a Twitter message in a day? What is the test statistic for this hypothesis?A)z-statistic
B)t-statistic
C)p-statistic
D)df-statistic
Question
A recent study focused on the amount of money single men and women save monthly. The information is summarized next. Assume that the population standard deviations are equal.  At the .01 significance level, do women save more money than men? What is the test statistic for this hypothesis?
A)z-statistic
B)t-statistic
C)p-statistic
D)df-statistic
At the .01 significance level, do women save more money than men? What is the test statistic for this hypothesis?A)z-statistic
B)t-statistic
C)p-statistic
D)df-statistic
Question
Question
Question
Question
Question
Question
Question
Question
A recent study focused on the number of times men and women send a Twitter message in a day. The information is summarized next. 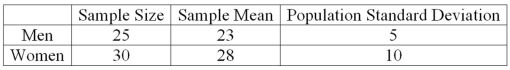 At the .01 significance level, is there a difference in the mean number of times men and women send a Twitter message in a day? What is the p-value for this hypothesis test?
A)0.0500
B)0.0164
C)0.0001
D)0.0082
At the .01 significance level, is there a difference in the mean number of times men and women send a Twitter message in a day? What is the p-value for this hypothesis test?A)0.0500
B)0.0164
C)0.0001
D)0.0082
Question
A recent study focused on the number of times men and women send a Twitter message in a day. The information is summarized next. 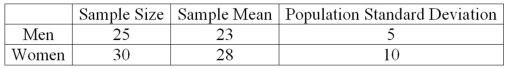 At the .01 significance level, is there a difference in the mean number of times men and women send a Twitter message in a day? Based on the p-value, what is your conclusion?
A)Reject the null hypothesis and conclude the means are different.
B)Reject the null hypothesis and conclude the means are the same.
C)Fail to reject the null hypothesis.
D)Fail to reject the null hypothesis and conclude the means are different.
At the .01 significance level, is there a difference in the mean number of times men and women send a Twitter message in a day? Based on the p-value, what is your conclusion?A)Reject the null hypothesis and conclude the means are different.
B)Reject the null hypothesis and conclude the means are the same.
C)Fail to reject the null hypothesis.
D)Fail to reject the null hypothesis and conclude the means are different.
Question
Question
Question
Question
Question
Question
Question
Question
Question
Question
Question
Question
A recent study focused on the amount of money single men and women save monthly. The information is summarized next. Assume that the population standard deviations are equal. 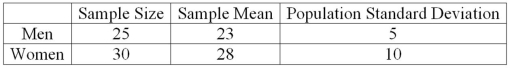 At the .01 significance level, do women save more money than men? What is the value of the test statistic for this hypothesis test?
A)+6.213
B)+1.318
C)+2.632
D)+2.40
At the .01 significance level, do women save more money than men? What is the value of the test statistic for this hypothesis test?A)+6.213
B)+1.318
C)+2.632
D)+2.40
Question
A recent study focused on the amount of money single men and women save monthly. The information is summarized next. Assume that the population standard deviations are equal. 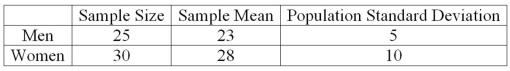 At the .01 significance level, do women save more money than men? What is the critical value for this hypothesis test?
A)+6.213
B)+2.369
C)+2.632
D)+2.40
At the .01 significance level, do women save more money than men? What is the critical value for this hypothesis test?A)+6.213
B)+2.369
C)+2.632
D)+2.40
Question
Question
Question
A recent study focused on the amount of money single men and women save monthly. The information is summarized next. Assume that the population standard deviations are equal. 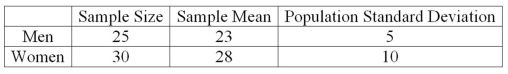 At the .01 significance level, what is the conclusion about the way women and men save?
A)Reject the null hypothesis and conclude that women save more than men.
B)Reject the null hypothesis and conclude that women and men save the same amount.
C)Fail to reject the null hypothesis.
D)Fail to reject the null hypothesis and conclude the means are different.
At the .01 significance level, what is the conclusion about the way women and men save?A)Reject the null hypothesis and conclude that women save more than men.
B)Reject the null hypothesis and conclude that women and men save the same amount.
C)Fail to reject the null hypothesis.
D)Fail to reject the null hypothesis and conclude the means are different.
Question
Question
The net weights (in grams) of a sample of bottles filled by a machine manufactured by Edne, and the net weights of a sample filled by a similar machine manufactured by Orno, Inc., are: 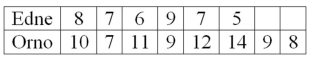 Testing the claim at the 0.05 level that the mean weight of the bottles filled by the Orno machine is greater than the mean weight of the bottles filled by the Edne machine, what is the critical value? Assume equal standard deviations for both samples.
A)+2.179
B)+2.145
C)+1.782
D)+1.761
Testing the claim at the 0.05 level that the mean weight of the bottles filled by the Orno machine is greater than the mean weight of the bottles filled by the Edne machine, what is the critical value? Assume equal standard deviations for both samples.A)+2.179
B)+2.145
C)+1.782
D)+1.761
Question
Question
Question
Question
Question
Question
Question
Question
A national manufacturer of ball bearings is experimenting with two different processes for producing precision ball bearings. It is important that the diameters be as close as possible to an industry standard. The output from each process is sampled and the average error from the industry standard is measured in millimeters. The results are presented next. 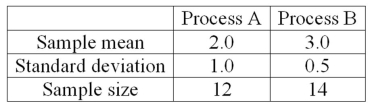 The researcher is interested in determining whether there is evidence that the two processes yield different average errors. The population standard deviations are unknown but assumed equal. What is the alternate hypothesis?
A)H1: µA = µB
B)H1: µA ≠ µB
C)H1: µA ≤ µB
D)H1: µA > µB
The researcher is interested in determining whether there is evidence that the two processes yield different average errors. The population standard deviations are unknown but assumed equal. What is the alternate hypothesis?A)H1: µA = µB
B)H1: µA ≠ µB
C)H1: µA ≤ µB
D)H1: µA > µB
Question
An investigation of the effectiveness of a training program to improve customer relationships included a pre-training and post-training customer survey. To compare the differences, they computed (post-training survey score - pre-training survey score). Seven customers were randomly selected and completed both surveys. The results follow. 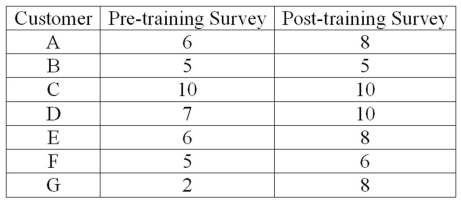 This analysis is an example of _____________.
A)A one-sample test of means
B)A two-sample test of means
C)A paired t-test
D)A test of proportions
This analysis is an example of _____________.A)A one-sample test of means
B)A two-sample test of means
C)A paired t-test
D)A test of proportions
Question
The results of a mathematics placement exam at two different campuses of Mercy College follow: 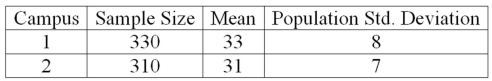 What is the computed value of the test statistic?
A)9.30
B)2.60
C)3.37
D)3.40
What is the computed value of the test statistic?A)9.30
B)2.60
C)3.37
D)3.40
Question
A national manufacturer of ball bearings is experimenting with two different processes for producing precision ball bearings. It is important that the diameters be as close as possible to an industry standard. The output from each process is sampled and the average error from the industry standard is measured in millimeters. The results are presented next. 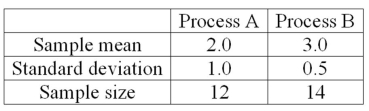 The researcher is interested in determining whether there is evidence that the two processes yield different average errors. The population standard deviations are unknown but are assumed equal. What is the computed value of t?
A)+2.797
B)-1.000
C)-3.299
D)0.5938
The researcher is interested in determining whether there is evidence that the two processes yield different average errors. The population standard deviations are unknown but are assumed equal. What is the computed value of t?A)+2.797
B)-1.000
C)-3.299
D)0.5938
Question
The results of a mathematics placement exam at two different campuses of Mercy College follow: 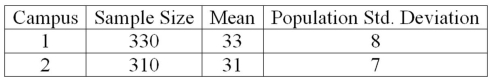 What is the alternative hypothesis if we want to test the hypothesis that the mean score on Campus 1 is higher than on Campus 2?
A)H1: µ1 = 0
B)H1: µ2 = 0
C)H1: µ1 > µ2
D)H1: µ1 ≤ µ2
What is the alternative hypothesis if we want to test the hypothesis that the mean score on Campus 1 is higher than on Campus 2?A)H1: µ1 = 0
B)H1: µ2 = 0
C)H1: µ1 > µ2
D)H1: µ1 ≤ µ2
Question
A national manufacturer of ball bearings is experimenting with two different processes for producing precision ball bearings. It is important that the diameters be as close as possible to an industry standard. The output from each process is sampled and the average error from the industry standard is measured in millimeters. The results are presented next. 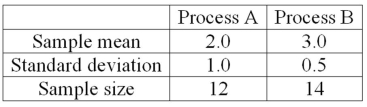 The researcher is interested in determining whether there is evidence that the two processes yield different average errors. The population standard deviations are unknown but are assumed equal. If we test the null hypothesis at the 1% level of significance, what is the decision?
A)Reject the null hypothesis and conclude the means are different.
B)Reject the null hypothesis and conclude the means are the same.
C)Fail to reject the null hypothesis.
D)Fail to reject the null hypothesis and conclude the means are different.
The researcher is interested in determining whether there is evidence that the two processes yield different average errors. The population standard deviations are unknown but are assumed equal. If we test the null hypothesis at the 1% level of significance, what is the decision?A)Reject the null hypothesis and conclude the means are different.
B)Reject the null hypothesis and conclude the means are the same.
C)Fail to reject the null hypothesis.
D)Fail to reject the null hypothesis and conclude the means are different.
Question
The results of a mathematics placement exam at two different campuses of Mercy College follow: 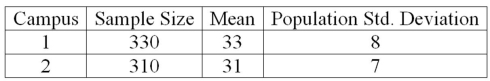 Given that the two population standard deviations are known, what is the p-value?
A)1.0
B)0.0
C)0.05
D)0.95
Given that the two population standard deviations are known, what is the p-value?A)1.0
B)0.0
C)0.05
D)0.95
Question
Accounting procedures allow a business to evaluate their inventory costs based on two methods: LIFO (Last In First Out) or FIFO (First In First Out). A manufacturer evaluated its finished goods inventory (in $000s) for five products with the LIFO and FIFO methods. To analyze the difference, they computed (FIFO - LIFO) for each product. Based on the following results, does the LIFO method result in a lower cost of inventory than the FIFO method?  What is the alternate hypothesis?
A)H1: µd = 0
B)H1: µd ≠ 0
C)H1: µd ≤ 0
D)H1: µd > 0
What is the alternate hypothesis?A)H1: µd = 0
B)H1: µd ≠ 0
C)H1: µd ≤ 0
D)H1: µd > 0
Question
A national manufacturer of ball bearings is experimenting with two different processes for producing precision ball bearings. It is important that the diameters be as close as possible to an industry standard. The output from each process is sampled and the average error from the industry standard is measured in millimeters. The results are presented next. 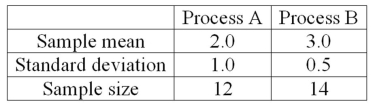 The researcher is interested in determining whether there is evidence that the two processes yield different average errors. The population standard deviations are unknown but are assumed equal. What are the degrees of freedom?
A)10
B)13
C)26
D)24
The researcher is interested in determining whether there is evidence that the two processes yield different average errors. The population standard deviations are unknown but are assumed equal. What are the degrees of freedom?A)10
B)13
C)26
D)24
Question
An investigation of the effectiveness of a training program to improve customer relationships included a pre-training and post-training customer survey. To compare the differences they computed (post-training survey score - pre-training survey score). Seven customers were randomly selected and completed both surveys. The results follow. 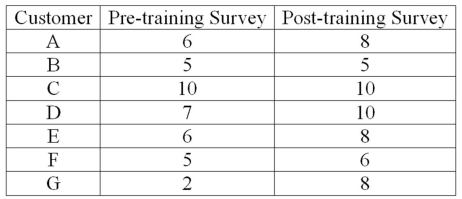 What is the value of the test statistic?
A)1.943
B)1.895
C)2.542
D)2.447
What is the value of the test statistic?A)1.943
B)1.895
C)2.542
D)2.447
Question
An investigation of the effectiveness of a training program to improve customer relationships included a pre-training and post-training customer survey. To compare the differences they computed (post-training survey score - pre-training survey score). Seven customers were randomly selected and completed both surveys. The results follow. 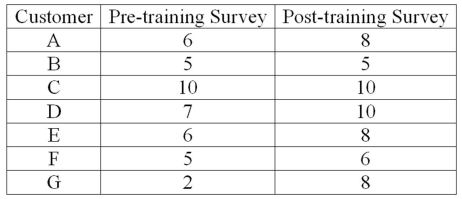 For a 0.05 significance level, what is the decision regarding the hypothesis that the training was effective in improving customer relationships?
A)Reject the null hypothesis and conclude that the training was effective.
B)Reject the null hypothesis and conclude that the training was ineffective.
C)Fail to reject the null hypothesis and conclude that mean survey scores are the same.
D)Fail to reject the null hypothesis and conclude that the mean survey scores are not equal.
For a 0.05 significance level, what is the decision regarding the hypothesis that the training was effective in improving customer relationships?A)Reject the null hypothesis and conclude that the training was effective.
B)Reject the null hypothesis and conclude that the training was ineffective.
C)Fail to reject the null hypothesis and conclude that mean survey scores are the same.
D)Fail to reject the null hypothesis and conclude that the mean survey scores are not equal.
Question
A national manufacturer of ball bearings is experimenting with two different processes for producing precision ball bearings. It is important that the diameters be as close as possible to an industry standard. The output from each process is sampled and the average error from the industry standard is measured in millimeters. The results are presented next. 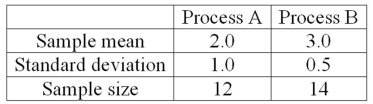 The researcher is interested in determining whether there is evidence that the two processes yield different average errors. The population standard deviations are unknown but are assumed equal. What is the null hypothesis?
A)H0: µA = µB
B)H0: µA ≠ µB
C)H0: µA ≤ µB
D)H0: µA > µB
The researcher is interested in determining whether there is evidence that the two processes yield different average errors. The population standard deviations are unknown but are assumed equal. What is the null hypothesis?A)H0: µA = µB
B)H0: µA ≠ µB
C)H0: µA ≤ µB
D)H0: µA > µB
Question
A company is researching the effectiveness of a new website design to decrease the time to access a website. Five website users were randomly selected, and their times (in seconds) to access the website with the old and new designs were recorded. To compare the times, they computed (new website design time - old website design time). The results follow.  What is the null hypothesis?
A)H0: µd = 0
B)H0: µd ≠ 0
C)H0: µd ≤ 0
D)H0: µd ≥ 0
What is the null hypothesis?A)H0: µd = 0
B)H0: µd ≠ 0
C)H0: µd ≤ 0
D)H0: µd ≥ 0
Question
Accounting procedures allow a business to evaluate their inventory costs based on two methods: LIFO (Last In First Out) or FIFO (First In First Out). A manufacturer evaluated its finished goods inventory (in $000s) for five products with the LIFO and FIFO methods. To analyze the difference, they computed (FIFO - LIFO) for each product. Based on the following results, does the LIFO method result in a lower cost of inventory than the FIFO method? 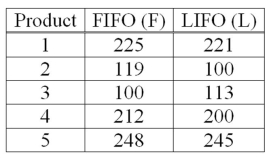 What is the null hypothesis?
A)H0: µd = 0
B)H0: µd ≠ 0
C)H0: µd ≤ 0
D)H0: µd ≥ 0
What is the null hypothesis?A)H0: µd = 0
B)H0: µd ≠ 0
C)H0: µd ≤ 0
D)H0: µd ≥ 0
Question
A national manufacturer of ball bearings is experimenting with two different processes for producing precision ball bearings. It is important that the diameters be as close as possible to an industry standard. The output from each process is sampled and the average error from the industry standard is measured in millimeters. The results are presented next. 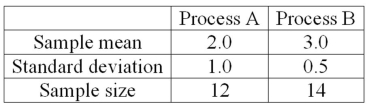 The researcher is interested in determining whether there is evidence that the two processes yield different average errors. The population standard deviations are unknown but assumed equal. What is the critical t value at the 1% level of significance?
A)+2.797
B)-2.492
C)±1.711
D)±2.797
The researcher is interested in determining whether there is evidence that the two processes yield different average errors. The population standard deviations are unknown but assumed equal. What is the critical t value at the 1% level of significance?A)+2.797
B)-2.492
C)±1.711
D)±2.797
Question
An investigation of the effectiveness of a training program to improve customer relationships included a pre-training and post-training customer survey. To compare the differences they computed (post-training survey score - pre-training survey score). Seven customers were randomly selected and completed both surveys. The results follow. 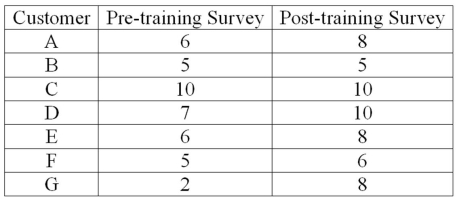 For a 0.05 significance level, what is the critical value?
A)1.943
B)1.895
C)1.645
D)2.447
For a 0.05 significance level, what is the critical value?A)1.943
B)1.895
C)1.645
D)2.447
Question
A national manufacturer of ball bearings is experimenting with two different processes for producing precision ball bearings. It is important that the diameters be as close as possible to an industry standard. The output from each process is sampled and the average error from the industry standard is measured in millimeters. The results are presented next. 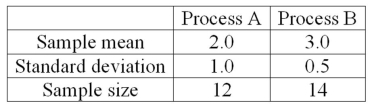 The researcher is interested in determining whether there is evidence that the two processes yield different average errors. The population standard deviations are unknown but are assumed equal. This example is what type of test?
A)A one-sample test of means
B)A two-sample test of means
C)A paired t-test
D)A test of proportions
The researcher is interested in determining whether there is evidence that the two processes yield different average errors. The population standard deviations are unknown but are assumed equal. This example is what type of test?A)A one-sample test of means
B)A two-sample test of means
C)A paired t-test
D)A test of proportions
Question
Question
The results of a mathematics placement exam at two different campuses of Mercy College follow: 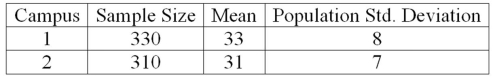 What is the null hypothesis if we want to test the hypothesis that the mean score on Campus 1 is higher than on Campus 2?
A)H0: µ1 = 0
B)H0: µ2 = 0
C)H0: µ1 = µ2
D)H0: µ1 ≤ µ2
What is the null hypothesis if we want to test the hypothesis that the mean score on Campus 1 is higher than on Campus 2?A)H0: µ1 = 0
B)H0: µ2 = 0
C)H0: µ1 = µ2
D)H0: µ1 ≤ µ2
Question
A company is researching the effectiveness of a new website design to decrease the time to access a website. Five website users were randomly selected, and their times (in seconds) to access the website with the old and new designs were recorded. To compare the times, they computed (new website design time - old website design time). The results follow.  What is the alternative hypothesis?
A)H1: µd = 0
B)H1: µd ≠ 0
C)H1: µd > 0
D)H1: µd < 0
What is the alternative hypothesis?A)H1: µd = 0
B)H1: µd ≠ 0
C)H1: µd > 0
D)H1: µd < 0
Question
Question
Question
A company is researching the effectiveness of a new website design to decrease the time to access a website. Five website users were randomly selected, and their times (in seconds) to access the website with the old and new designs were recorded. To compare the times, they computed (new website design time - old website design time). The results follow.  For a 0.01 significance level, what is the decision regarding the hypothesis that the training was effective in improving customer relationships?
A)Reject the null hypothesis and conclude that the new design reduced mean access times.
B)Reject the null hypothesis and conclude that the new design did not reduce mean access times.
C)Fail to reject the null hypothesis.
D)Fail to reject the null hypothesis and conclude that the mean access times are inaccurate.
For a 0.01 significance level, what is the decision regarding the hypothesis that the training was effective in improving customer relationships?A)Reject the null hypothesis and conclude that the new design reduced mean access times.
B)Reject the null hypothesis and conclude that the new design did not reduce mean access times.
C)Fail to reject the null hypothesis.
D)Fail to reject the null hypothesis and conclude that the mean access times are inaccurate.
Question
Question
Accounting procedures allow a business to evaluate its inventory costs based on two methods: LIFO (Last In First Out) or FIFO (First In First Out). A manufacturer evaluated its finished goods inventory (in $000s) for five products with the LIFO and FIFO methods. To analyze the difference, they computed (FIFO - LIFO) for each product. Based on the following results, does the LIFO method result in a lower cost of inventory than the FIFO method? 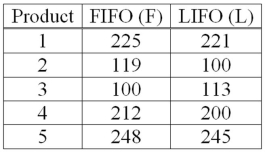 What is the value of calculated t?
A)+0.933
B)±2.776
C)+0.47
D)-2.028
What is the value of calculated t?A)+0.933
B)±2.776
C)+0.47
D)-2.028
Question
Question
Question
A company is researching the effectiveness of a new website design to decrease the time to access a website. Five website users were randomly selected, and their times (in seconds) to access the website with the old and new designs were recorded. To compare the times, they computed (new website design time - old website design time). The results follow.  For a 0.01 significance level, what is the critical value?
A)2.256
B)1.895
C)3.747
D)2.447
For a 0.01 significance level, what is the critical value?A)2.256
B)1.895
C)3.747
D)2.447
Question
Question
Accounting procedures allow a business to evaluate its inventory costs based on two methods: LIFO (Last In First Out) or FIFO (First In First Out). A manufacturer evaluated its finished goods inventory (in $000s) for five products with the LIFO and FIFO methods. To analyze the difference, they computed (FIFO - LIFO) for each product. Based on the following results, does the LIFO method result in a lower cost of inventory than the FIFO method? 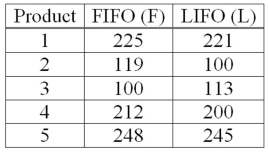 What is the decision at the 5% level of significance?
A)Fail to reject the null hypothesis and conclude LIFO is more effective.
B)Reject the null hypothesis and conclude LIFO is more effective.
C)Reject the alternate hypothesis and conclude LIFO is more effective.
D)Fail to reject the null hypothesis.
What is the decision at the 5% level of significance?A)Fail to reject the null hypothesis and conclude LIFO is more effective.
B)Reject the null hypothesis and conclude LIFO is more effective.
C)Reject the alternate hypothesis and conclude LIFO is more effective.
D)Fail to reject the null hypothesis.
Question
Question
Question
Question
Question
Question
Accounting procedures allow a business to evaluate their inventory costs based on two methods: LIFO (Last In First Out) or FIFO (First In First Out). A manufacturer evaluated its finished goods inventory (in $000s) for five products with the LIFO and FIFO methods. To analyze the difference, they computed (FIFO - LIFO) for each product. Based on the following results, does the LIFO method result in a lower cost of inventory than the FIFO method? 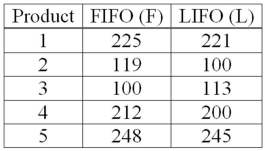 What are the degrees of freedom?
A)4
B)5
C)15
D)10
What are the degrees of freedom?A)4
B)5
C)15
D)10
Question
A company is researching the effectiveness of a new website design to decrease the time to access a website. Five website users were randomly selected, and their times (in seconds) to access the website with the old and new designs were recorded. To compare the times, they computed (new website design time - old website design time). The results follow.  What is the value of the test statistic?
A)2.256
B)1.895
C)3.747
D)2.447
What is the value of the test statistic?A)2.256
B)1.895
C)3.747
D)2.447
Question
Accounting procedures allow a business to evaluate its inventory costs based on two methods: LIFO (Last In First Out) or FIFO (First In First Out). A manufacturer evaluated its finished goods inventory (in $000s) for five products with the LIFO and FIFO methods. To analyze the difference, they computed (FIFO - LIFO) for each product. Based on the following results, does the LIFO method result in a lower cost of inventory than the FIFO method? 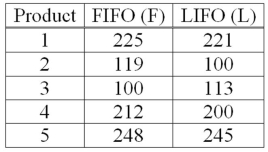 This example is what type of test?
A)A one-sample test of means.
B)A two-sample test of means.
C)A paired t-test.
D)A test of proportions.
This example is what type of test?A)A one-sample test of means.
B)A two-sample test of means.
C)A paired t-test.
D)A test of proportions.
Question
Question
Accounting procedures allow a business to evaluate their inventory costs based on two methods: LIFO (Last In First Out) or FIFO (First In First Out). A manufacturer evaluated its finished goods inventory (in $000s) for five products with the LIFO and FIFO methods. To analyze the difference, they computed (FIFO - LIFO) for each product. Based on the following results, does the LIFO method result in a lower cost of inventory than the FIFO method?  If you use the 5% level of significance, what is the critical t value?
A)+2.132
B)±2.132
C)+2.262
D)±2.228
If you use the 5% level of significance, what is the critical t value?A)+2.132
B)±2.132
C)+2.262
D)±2.228

Unlock Deck
Sign up to unlock the cards in this deck!
Unlock Deck
Unlock Deck
1/122
Play
Full screen (f)
Deck 11: Two-Sample Tests of Hypothesis
1
If the null hypothesis states that there is no difference between the mean net income of retail stores in Chicago and New York City, then the test is two-tailed.
True
2
A recent study focused on the number of times men and women send a Twitter message in a day. The information is summarized next. At the .01 significance level, is there a difference in the mean number of times men and women send a Twitter message in a day? What is the value of the test statistic for this hypothesis test?
A)2.668
B)2.672
C)2.58
D)2.40
At the .01 significance level, is there a difference in the mean number of times men and women send a Twitter message in a day? What is the value of the test statistic for this hypothesis test?A)2.668
B)2.672
C)2.58
D)2.40
2.40
3
If the decision is to reject the null hypothesis of no difference between two population proportions at the 5% level of significance, what are the alternative hypothesis and rejection region?
A)H1: π1 ≠ π2; z > +1.645 and z < -1.645
B)H1: π1 ≠ π2; z > +1.960 and z < -1.960
C)H1: π1 > π2; z < -1.645
D)H1: π1 > π2; z < -1.960
A)H1: π1 ≠ π2; z > +1.645 and z < -1.645
B)H1: π1 ≠ π2; z > +1.960 and z < -1.960
C)H1: π1 > π2; z < -1.645
D)H1: π1 > π2; z < -1.960
H1: π1 ≠ π2; z > +1.960 and z < -1.960
4
When dependent samples are used to test for differences in the means, we compute paired differences.
Unlock Deck
Unlock for access to all 122 flashcards in this deck.
Unlock Deck
k this deck
5
A recent study focused on the number of times men and women send a Twitter message in a day. The sample information is summarized below. At the .01 significance level, is there a difference in the mean number of times men and women send a Twitter message in a day? What is the test statistic for this hypothesis?
A)z-statistic
B)t-statistic
C)p-statistic
D)df-statistic
At the .01 significance level, is there a difference in the mean number of times men and women send a Twitter message in a day? What is the test statistic for this hypothesis?A)z-statistic
B)t-statistic
C)p-statistic
D)df-statistic
Unlock Deck
Unlock for access to all 122 flashcards in this deck.
Unlock Deck
k this deck
6
A recent study focused on the amount of money single men and women save monthly. The information is summarized next. Assume that the population standard deviations are equal. At the .01 significance level, do women save more money than men? What is the test statistic for this hypothesis?
A)z-statistic
B)t-statistic
C)p-statistic
D)df-statistic
At the .01 significance level, do women save more money than men? What is the test statistic for this hypothesis?A)z-statistic
B)t-statistic
C)p-statistic
D)df-statistic
Unlock Deck
Unlock for access to all 122 flashcards in this deck.
Unlock Deck
k this deck
7
The pooled estimate of the proportion is found by dividing the total number of samples by the total number of successes.
Unlock Deck
Unlock for access to all 122 flashcards in this deck.
Unlock Deck
k this deck
8
If we are testing the difference between two population proportions, it is assumed that the two populations are approximately normal and have equal variances.
Unlock Deck
Unlock for access to all 122 flashcards in this deck.
Unlock Deck
k this deck
9
When the standard deviations are equal but unknown, a test for the differences between two population means has n - 1 degrees of freedom.
Unlock Deck
Unlock for access to all 122 flashcards in this deck.
Unlock Deck
k this deck
10
In testing the difference between two population proportions, we pool the two sample proportions to estimate the population proportion.
Unlock Deck
Unlock for access to all 122 flashcards in this deck.
Unlock Deck
k this deck
11
If we are testing for the difference between two population means and assume that the two populations have equal but unknown standard deviations, the variances are pooled to compute the best estimated variance.
Unlock Deck
Unlock for access to all 122 flashcards in this deck.
Unlock Deck
k this deck
12
If we are testing for the difference between two population means and assume that the two populations have equal and unknown standard deviations, the degrees of freedom are computed as (n1)(n2) - 1.
Unlock Deck
Unlock for access to all 122 flashcards in this deck.
Unlock Deck
k this deck
13
In a market test of a new chocolate raspberry coffee, a poll of 400 people from Dobbs Ferry showed 250 preferred the new coffee. In Irvington, 170 out of 350 people preferred the new coffee. To test the hypothesis that there is no difference in preferences between the two villages, what is the null hypothesis?
A)H0: π1 < π2
B)H0: π1 > π2
C)H0: π1 = π2
D)H0: π1 ≠ π2
A)H0: π1 < π2
B)H0: π1 > π2
C)H0: π1 = π2
D)H0: π1 ≠ π2
Unlock Deck
Unlock for access to all 122 flashcards in this deck.
Unlock Deck
k this deck
14
A recent study focused on the number of times men and women send a Twitter message in a day. The information is summarized next. At the .01 significance level, is there a difference in the mean number of times men and women send a Twitter message in a day? What is the p-value for this hypothesis test?
A)0.0500
B)0.0164
C)0.0001
D)0.0082
At the .01 significance level, is there a difference in the mean number of times men and women send a Twitter message in a day? What is the p-value for this hypothesis test?A)0.0500
B)0.0164
C)0.0001
D)0.0082
Unlock Deck
Unlock for access to all 122 flashcards in this deck.
Unlock Deck
k this deck
15
A recent study focused on the number of times men and women send a Twitter message in a day. The information is summarized next. At the .01 significance level, is there a difference in the mean number of times men and women send a Twitter message in a day? Based on the p-value, what is your conclusion?
A)Reject the null hypothesis and conclude the means are different.
B)Reject the null hypothesis and conclude the means are the same.
C)Fail to reject the null hypothesis.
D)Fail to reject the null hypothesis and conclude the means are different.
At the .01 significance level, is there a difference in the mean number of times men and women send a Twitter message in a day? Based on the p-value, what is your conclusion?A)Reject the null hypothesis and conclude the means are different.
B)Reject the null hypothesis and conclude the means are the same.
C)Fail to reject the null hypothesis.
D)Fail to reject the null hypothesis and conclude the means are different.
Unlock Deck
Unlock for access to all 122 flashcards in this deck.
Unlock Deck
k this deck
16
If two dependent samples of size 20 are used to test the difference between the means, the degrees of freedom for a t-statistic are 19.
Unlock Deck
Unlock for access to all 122 flashcards in this deck.
Unlock Deck
k this deck
17
A statistics professor wants to compare grades in two different classes of the same course. This is an example of a paired sample.
Unlock Deck
Unlock for access to all 122 flashcards in this deck.
Unlock Deck
k this deck
18
If we are testing for the difference between two population means, it is assumed that the sample observations from one population are independent of the sample observations from the other population.
Unlock Deck
Unlock for access to all 122 flashcards in this deck.
Unlock Deck
k this deck
19
When dependent samples are used to test for differences in the means, we pool the sample variances.
Unlock Deck
Unlock for access to all 122 flashcards in this deck.
Unlock Deck
k this deck
20
If the null hypothesis states that there is no difference between the mean income of males and the mean income of females, then the test is one-tailed.
Unlock Deck
Unlock for access to all 122 flashcards in this deck.
Unlock Deck
k this deck
21
Twenty randomly selected statistics students were given 15 multiple-choice questions and 15 open-ended questions, all on the same material. The professor was interested in determining if students scored higher on the multiple-choice questions. This experiment is an example of ________________.
A)A one-sample test of means
B)A two-sample test of means
C)A paired t-test
D)A test of proportions
A)A one-sample test of means
B)A two-sample test of means
C)A paired t-test
D)A test of proportions
Unlock Deck
Unlock for access to all 122 flashcards in this deck.
Unlock Deck
k this deck
22
If the null hypothesis that two means are equal is true, where will 97% of the computed z values lie between?
A)±2.58
B)±2.33
C)±2.17
D)±2.07
A)±2.58
B)±2.33
C)±2.17
D)±2.07
Unlock Deck
Unlock for access to all 122 flashcards in this deck.
Unlock Deck
k this deck
23
Two samples, one of size 14 and the second of size 13, are selected to test the difference between two population means. How many degrees of freedom are used to find the critical value? Assume the population standard deviations are equal.
A)27
B)26
C)25
D)14
A)27
B)26
C)25
D)14
Unlock Deck
Unlock for access to all 122 flashcards in this deck.
Unlock Deck
k this deck
24
In a market test of a new chocolate raspberry coffee, a poll of 400 people (sample 1) from Dobbs Ferry showed 250 preferred the new coffee. In Irvington, 170 out of 350 people (sample 2) preferred the new coffee. To test the hypothesis that a higher proportion of people in Dobbs Ferry prefer the new coffee, what is the alternate hypothesis?
A)H1: π1 < π2
B)H1: π1 > π2
C)H1: π1 = π2
D)H1: π1 ≠ π2
A)H1: π1 < π2
B)H1: π1 > π2
C)H1: π1 = π2
D)H1: π1 ≠ π2
Unlock Deck
Unlock for access to all 122 flashcards in this deck.
Unlock Deck
k this deck
25
A sample of 250 adults tried the new multigrain cereal "Wow!" A total of 187 rated it as excellent. In a sample of 100 children, 66 rated it as excellent. Using the 0.1 significance level, the researcher wishes to show that adults like the cereal better than children. What is the pooled proportion?
A)0.723
B)1.408
C)0.494
D)0.807
A)0.723
B)1.408
C)0.494
D)0.807
Unlock Deck
Unlock for access to all 122 flashcards in this deck.
Unlock Deck
k this deck
26
For a hypothesis test comparing two population means, the combined degrees of freedom are 24. Which of the following statements about the two sample sizes is NOT true? Assume the population standard deviations are equal.
A)n1 = 11; n2 = 13
B)n1 = 12; n2 = 14
C)n1 = 13; n2 = 13
D)n1 = 10; n2 = 16
A)n1 = 11; n2 = 13
B)n1 = 12; n2 = 14
C)n1 = 13; n2 = 13
D)n1 = 10; n2 = 16
Unlock Deck
Unlock for access to all 122 flashcards in this deck.
Unlock Deck
k this deck
27
A recent study focused on the amount of money single men and women save monthly. The information is summarized next. Assume that the population standard deviations are equal. At the .01 significance level, do women save more money than men? What is the value of the test statistic for this hypothesis test?
A)+6.213
B)+1.318
C)+2.632
D)+2.40
At the .01 significance level, do women save more money than men? What is the value of the test statistic for this hypothesis test?A)+6.213
B)+1.318
C)+2.632
D)+2.40
Unlock Deck
Unlock for access to all 122 flashcards in this deck.
Unlock Deck
k this deck
28
A recent study focused on the amount of money single men and women save monthly. The information is summarized next. Assume that the population standard deviations are equal. At the .01 significance level, do women save more money than men? What is the critical value for this hypothesis test?
A)+6.213
B)+2.369
C)+2.632
D)+2.40
At the .01 significance level, do women save more money than men? What is the critical value for this hypothesis test?A)+6.213
B)+2.369
C)+2.632
D)+2.40
Unlock Deck
Unlock for access to all 122 flashcards in this deck.
Unlock Deck
k this deck
29
A sample of 250 adults tried the new multigrain cereal "Wow!" A total of 187 rated it as excellent. In a sample of 100 children, 66 rated it as excellent. Using the 0.1 significance level, the researcher wishes to show that adults like the cereal better than children. Which of the following is the alternate hypothesis?
A)H1: πA = πC
B)H1: πA < πC
C)H1: πA > πC
D)H1: πA ≠ πC
A)H1: πA = πC
B)H1: πA < πC
C)H1: πA > πC
D)H1: πA ≠ πC
Unlock Deck
Unlock for access to all 122 flashcards in this deck.
Unlock Deck
k this deck
30
We test for a hypothesized difference between two population means: H0: μ1 = μ2. The population standard deviations are unknown but assumed equal. The number of observations in the first sample is 15, and 12 in the second sample. How many degrees of freedom are associated with the critical value?
A)24
B)25
C)26
D)27
A)24
B)25
C)26
D)27
Unlock Deck
Unlock for access to all 122 flashcards in this deck.
Unlock Deck
k this deck
31
A recent study focused on the amount of money single men and women save monthly. The information is summarized next. Assume that the population standard deviations are equal. At the .01 significance level, what is the conclusion about the way women and men save?
A)Reject the null hypothesis and conclude that women save more than men.
B)Reject the null hypothesis and conclude that women and men save the same amount.
C)Fail to reject the null hypothesis.
D)Fail to reject the null hypothesis and conclude the means are different.
At the .01 significance level, what is the conclusion about the way women and men save?A)Reject the null hypothesis and conclude that women save more than men.
B)Reject the null hypothesis and conclude that women and men save the same amount.
C)Fail to reject the null hypothesis.
D)Fail to reject the null hypothesis and conclude the means are different.
Unlock Deck
Unlock for access to all 122 flashcards in this deck.
Unlock Deck
k this deck
32
For a hypothesis comparing two population means, H0: μ1 ≤ μ2, what is the critical value for a one-tailed hypothesis test, using a 5% significance level, with both sample sizes equal to 13? Assume the population standard deviations are equal.
A)±1.711
B)+1.711
C)+2.060
D)+2.064
A)±1.711
B)+1.711
C)+2.060
D)+2.064
Unlock Deck
Unlock for access to all 122 flashcards in this deck.
Unlock Deck
k this deck
33
The net weights (in grams) of a sample of bottles filled by a machine manufactured by Edne, and the net weights of a sample filled by a similar machine manufactured by Orno, Inc., are: Testing the claim at the 0.05 level that the mean weight of the bottles filled by the Orno machine is greater than the mean weight of the bottles filled by the Edne machine, what is the critical value? Assume equal standard deviations for both samples.
A)+2.179
B)+2.145
C)+1.782
D)+1.761
Testing the claim at the 0.05 level that the mean weight of the bottles filled by the Orno machine is greater than the mean weight of the bottles filled by the Edne machine, what is the critical value? Assume equal standard deviations for both samples.A)+2.179
B)+2.145
C)+1.782
D)+1.761
Unlock Deck
Unlock for access to all 122 flashcards in this deck.
Unlock Deck
k this deck
34
Suppose we test H0: π1 = π2 at the 0.05 level of significance. If the z-test statistic is -1.07, what is our decision?
A)Reject the null hypothesis.
B)Do not reject the null hypothesis.
C)Take a larger sample.
D)Reserve judgment.
A)Reject the null hypothesis.
B)Do not reject the null hypothesis.
C)Take a larger sample.
D)Reserve judgment.
Unlock Deck
Unlock for access to all 122 flashcards in this deck.
Unlock Deck
k this deck
35
When testing the difference between two population means, the sample variances are pooled to estimate the population variance when ________________.
A)The population variances are known and equal
B)The population means are known
C)The population variances are assumed unequal and unknown
D)The population variances are assumed equal but unknown
A)The population variances are known and equal
B)The population means are known
C)The population variances are assumed unequal and unknown
D)The population variances are assumed equal but unknown
Unlock Deck
Unlock for access to all 122 flashcards in this deck.
Unlock Deck
k this deck
36
When is it appropriate to use the paired difference t-test?
A)When four samples are compared at once
B)When any two samples are compared
C)When two independent samples are compared
D)When two dependent samples are compared
A)When four samples are compared at once
B)When any two samples are compared
C)When two independent samples are compared
D)When two dependent samples are compared
Unlock Deck
Unlock for access to all 122 flashcards in this deck.
Unlock Deck
k this deck
37
Which condition must be met to conduct a test for the difference in two sample means using a z-statistic?
A)The data must be at least of nominal scale.
B)The populations must be normal.
C)The two population standard deviations must be known.
D)The samples are dependent.
A)The data must be at least of nominal scale.
B)The populations must be normal.
C)The two population standard deviations must be known.
D)The samples are dependent.
Unlock Deck
Unlock for access to all 122 flashcards in this deck.
Unlock Deck
k this deck
38
Assuming the population variances are known, the population variance of the difference between two means is _____________.
A)The sum of the two means
B)The sum of the two population variances
C)The sum of the two population standard deviations
D)The sum of the two sample sizes for each population
A)The sum of the two means
B)The sum of the two population variances
C)The sum of the two population standard deviations
D)The sum of the two sample sizes for each population
Unlock Deck
Unlock for access to all 122 flashcards in this deck.
Unlock Deck
k this deck
39
How is a pooled estimate of the population proportion represented?
A)pc
B)z
C)π
D)nπ
A)pc
B)z
C)π
D)nπ
Unlock Deck
Unlock for access to all 122 flashcards in this deck.
Unlock Deck
k this deck
40
When testing the difference between two dependent population means, the test statistic is based on a ______________.
A)Pooled variance
B)Standard deviation of the differences
C)Pooled proportion
D)Sum of the population variances
A)Pooled variance
B)Standard deviation of the differences
C)Pooled proportion
D)Sum of the population variances
Unlock Deck
Unlock for access to all 122 flashcards in this deck.
Unlock Deck
k this deck
41
A national manufacturer of ball bearings is experimenting with two different processes for producing precision ball bearings. It is important that the diameters be as close as possible to an industry standard. The output from each process is sampled and the average error from the industry standard is measured in millimeters. The results are presented next. The researcher is interested in determining whether there is evidence that the two processes yield different average errors. The population standard deviations are unknown but assumed equal. What is the alternate hypothesis?
A)H1: µA = µB
B)H1: µA ≠ µB
C)H1: µA ≤ µB
D)H1: µA > µB
The researcher is interested in determining whether there is evidence that the two processes yield different average errors. The population standard deviations are unknown but assumed equal. What is the alternate hypothesis?A)H1: µA = µB
B)H1: µA ≠ µB
C)H1: µA ≤ µB
D)H1: µA > µB
Unlock Deck
Unlock for access to all 122 flashcards in this deck.
Unlock Deck
k this deck
42
An investigation of the effectiveness of a training program to improve customer relationships included a pre-training and post-training customer survey. To compare the differences, they computed (post-training survey score - pre-training survey score). Seven customers were randomly selected and completed both surveys. The results follow. This analysis is an example of _____________.
A)A one-sample test of means
B)A two-sample test of means
C)A paired t-test
D)A test of proportions
This analysis is an example of _____________.A)A one-sample test of means
B)A two-sample test of means
C)A paired t-test
D)A test of proportions
Unlock Deck
Unlock for access to all 122 flashcards in this deck.
Unlock Deck
k this deck
43
The results of a mathematics placement exam at two different campuses of Mercy College follow: What is the computed value of the test statistic?
A)9.30
B)2.60
C)3.37
D)3.40
What is the computed value of the test statistic?A)9.30
B)2.60
C)3.37
D)3.40
Unlock Deck
Unlock for access to all 122 flashcards in this deck.
Unlock Deck
k this deck
44
A national manufacturer of ball bearings is experimenting with two different processes for producing precision ball bearings. It is important that the diameters be as close as possible to an industry standard. The output from each process is sampled and the average error from the industry standard is measured in millimeters. The results are presented next. The researcher is interested in determining whether there is evidence that the two processes yield different average errors. The population standard deviations are unknown but are assumed equal. What is the computed value of t?
A)+2.797
B)-1.000
C)-3.299
D)0.5938
The researcher is interested in determining whether there is evidence that the two processes yield different average errors. The population standard deviations are unknown but are assumed equal. What is the computed value of t?A)+2.797
B)-1.000
C)-3.299
D)0.5938
Unlock Deck
Unlock for access to all 122 flashcards in this deck.
Unlock Deck
k this deck
45
The results of a mathematics placement exam at two different campuses of Mercy College follow: What is the alternative hypothesis if we want to test the hypothesis that the mean score on Campus 1 is higher than on Campus 2?
A)H1: µ1 = 0
B)H1: µ2 = 0
C)H1: µ1 > µ2
D)H1: µ1 ≤ µ2
What is the alternative hypothesis if we want to test the hypothesis that the mean score on Campus 1 is higher than on Campus 2?A)H1: µ1 = 0
B)H1: µ2 = 0
C)H1: µ1 > µ2
D)H1: µ1 ≤ µ2
Unlock Deck
Unlock for access to all 122 flashcards in this deck.
Unlock Deck
k this deck
46
A national manufacturer of ball bearings is experimenting with two different processes for producing precision ball bearings. It is important that the diameters be as close as possible to an industry standard. The output from each process is sampled and the average error from the industry standard is measured in millimeters. The results are presented next. The researcher is interested in determining whether there is evidence that the two processes yield different average errors. The population standard deviations are unknown but are assumed equal. If we test the null hypothesis at the 1% level of significance, what is the decision?
A)Reject the null hypothesis and conclude the means are different.
B)Reject the null hypothesis and conclude the means are the same.
C)Fail to reject the null hypothesis.
D)Fail to reject the null hypothesis and conclude the means are different.
The researcher is interested in determining whether there is evidence that the two processes yield different average errors. The population standard deviations are unknown but are assumed equal. If we test the null hypothesis at the 1% level of significance, what is the decision?A)Reject the null hypothesis and conclude the means are different.
B)Reject the null hypothesis and conclude the means are the same.
C)Fail to reject the null hypothesis.
D)Fail to reject the null hypothesis and conclude the means are different.
Unlock Deck
Unlock for access to all 122 flashcards in this deck.
Unlock Deck
k this deck
47
The results of a mathematics placement exam at two different campuses of Mercy College follow: Given that the two population standard deviations are known, what is the p-value?
A)1.0
B)0.0
C)0.05
D)0.95
Given that the two population standard deviations are known, what is the p-value?A)1.0
B)0.0
C)0.05
D)0.95
Unlock Deck
Unlock for access to all 122 flashcards in this deck.
Unlock Deck
k this deck
48
Accounting procedures allow a business to evaluate their inventory costs based on two methods: LIFO (Last In First Out) or FIFO (First In First Out). A manufacturer evaluated its finished goods inventory (in $000s) for five products with the LIFO and FIFO methods. To analyze the difference, they computed (FIFO - LIFO) for each product. Based on the following results, does the LIFO method result in a lower cost of inventory than the FIFO method? What is the alternate hypothesis?
A)H1: µd = 0
B)H1: µd ≠ 0
C)H1: µd ≤ 0
D)H1: µd > 0
What is the alternate hypothesis?A)H1: µd = 0
B)H1: µd ≠ 0
C)H1: µd ≤ 0
D)H1: µd > 0
Unlock Deck
Unlock for access to all 122 flashcards in this deck.
Unlock Deck
k this deck
49
A national manufacturer of ball bearings is experimenting with two different processes for producing precision ball bearings. It is important that the diameters be as close as possible to an industry standard. The output from each process is sampled and the average error from the industry standard is measured in millimeters. The results are presented next. The researcher is interested in determining whether there is evidence that the two processes yield different average errors. The population standard deviations are unknown but are assumed equal. What are the degrees of freedom?
A)10
B)13
C)26
D)24
The researcher is interested in determining whether there is evidence that the two processes yield different average errors. The population standard deviations are unknown but are assumed equal. What are the degrees of freedom?A)10
B)13
C)26
D)24
Unlock Deck
Unlock for access to all 122 flashcards in this deck.
Unlock Deck
k this deck
50
An investigation of the effectiveness of a training program to improve customer relationships included a pre-training and post-training customer survey. To compare the differences they computed (post-training survey score - pre-training survey score). Seven customers were randomly selected and completed both surveys. The results follow. What is the value of the test statistic?
A)1.943
B)1.895
C)2.542
D)2.447
What is the value of the test statistic?A)1.943
B)1.895
C)2.542
D)2.447
Unlock Deck
Unlock for access to all 122 flashcards in this deck.
Unlock Deck
k this deck
51
An investigation of the effectiveness of a training program to improve customer relationships included a pre-training and post-training customer survey. To compare the differences they computed (post-training survey score - pre-training survey score). Seven customers were randomly selected and completed both surveys. The results follow. For a 0.05 significance level, what is the decision regarding the hypothesis that the training was effective in improving customer relationships?
A)Reject the null hypothesis and conclude that the training was effective.
B)Reject the null hypothesis and conclude that the training was ineffective.
C)Fail to reject the null hypothesis and conclude that mean survey scores are the same.
D)Fail to reject the null hypothesis and conclude that the mean survey scores are not equal.
For a 0.05 significance level, what is the decision regarding the hypothesis that the training was effective in improving customer relationships?A)Reject the null hypothesis and conclude that the training was effective.
B)Reject the null hypothesis and conclude that the training was ineffective.
C)Fail to reject the null hypothesis and conclude that mean survey scores are the same.
D)Fail to reject the null hypothesis and conclude that the mean survey scores are not equal.
Unlock Deck
Unlock for access to all 122 flashcards in this deck.
Unlock Deck
k this deck
52
A national manufacturer of ball bearings is experimenting with two different processes for producing precision ball bearings. It is important that the diameters be as close as possible to an industry standard. The output from each process is sampled and the average error from the industry standard is measured in millimeters. The results are presented next. The researcher is interested in determining whether there is evidence that the two processes yield different average errors. The population standard deviations are unknown but are assumed equal. What is the null hypothesis?
A)H0: µA = µB
B)H0: µA ≠ µB
C)H0: µA ≤ µB
D)H0: µA > µB
The researcher is interested in determining whether there is evidence that the two processes yield different average errors. The population standard deviations are unknown but are assumed equal. What is the null hypothesis?A)H0: µA = µB
B)H0: µA ≠ µB
C)H0: µA ≤ µB
D)H0: µA > µB
Unlock Deck
Unlock for access to all 122 flashcards in this deck.
Unlock Deck
k this deck
53
A company is researching the effectiveness of a new website design to decrease the time to access a website. Five website users were randomly selected, and their times (in seconds) to access the website with the old and new designs were recorded. To compare the times, they computed (new website design time - old website design time). The results follow. What is the null hypothesis?
A)H0: µd = 0
B)H0: µd ≠ 0
C)H0: µd ≤ 0
D)H0: µd ≥ 0
What is the null hypothesis?A)H0: µd = 0
B)H0: µd ≠ 0
C)H0: µd ≤ 0
D)H0: µd ≥ 0
Unlock Deck
Unlock for access to all 122 flashcards in this deck.
Unlock Deck
k this deck
54
Accounting procedures allow a business to evaluate their inventory costs based on two methods: LIFO (Last In First Out) or FIFO (First In First Out). A manufacturer evaluated its finished goods inventory (in $000s) for five products with the LIFO and FIFO methods. To analyze the difference, they computed (FIFO - LIFO) for each product. Based on the following results, does the LIFO method result in a lower cost of inventory than the FIFO method? What is the null hypothesis?
A)H0: µd = 0
B)H0: µd ≠ 0
C)H0: µd ≤ 0
D)H0: µd ≥ 0
What is the null hypothesis?A)H0: µd = 0
B)H0: µd ≠ 0
C)H0: µd ≤ 0
D)H0: µd ≥ 0
Unlock Deck
Unlock for access to all 122 flashcards in this deck.
Unlock Deck
k this deck
55
A national manufacturer of ball bearings is experimenting with two different processes for producing precision ball bearings. It is important that the diameters be as close as possible to an industry standard. The output from each process is sampled and the average error from the industry standard is measured in millimeters. The results are presented next. The researcher is interested in determining whether there is evidence that the two processes yield different average errors. The population standard deviations are unknown but assumed equal. What is the critical t value at the 1% level of significance?
A)+2.797
B)-2.492
C)±1.711
D)±2.797
The researcher is interested in determining whether there is evidence that the two processes yield different average errors. The population standard deviations are unknown but assumed equal. What is the critical t value at the 1% level of significance?A)+2.797
B)-2.492
C)±1.711
D)±2.797
Unlock Deck
Unlock for access to all 122 flashcards in this deck.
Unlock Deck
k this deck
56
An investigation of the effectiveness of a training program to improve customer relationships included a pre-training and post-training customer survey. To compare the differences they computed (post-training survey score - pre-training survey score). Seven customers were randomly selected and completed both surveys. The results follow. For a 0.05 significance level, what is the critical value?
A)1.943
B)1.895
C)1.645
D)2.447
For a 0.05 significance level, what is the critical value?A)1.943
B)1.895
C)1.645
D)2.447
Unlock Deck
Unlock for access to all 122 flashcards in this deck.
Unlock Deck
k this deck
57
A national manufacturer of ball bearings is experimenting with two different processes for producing precision ball bearings. It is important that the diameters be as close as possible to an industry standard. The output from each process is sampled and the average error from the industry standard is measured in millimeters. The results are presented next. The researcher is interested in determining whether there is evidence that the two processes yield different average errors. The population standard deviations are unknown but are assumed equal. This example is what type of test?
A)A one-sample test of means
B)A two-sample test of means
C)A paired t-test
D)A test of proportions
The researcher is interested in determining whether there is evidence that the two processes yield different average errors. The population standard deviations are unknown but are assumed equal. This example is what type of test?A)A one-sample test of means
B)A two-sample test of means
C)A paired t-test
D)A test of proportions
Unlock Deck
Unlock for access to all 122 flashcards in this deck.
Unlock Deck
k this deck
58
A sample of 250 adults tried the new multigrain cereal "Wow!" A total of 187 rated it as excellent. In a sample of 100 children, 66 rated it as excellent. Using the 0.1 significance level, the researcher wishes to show that adults like the cereal better than children. What test statistic should we use to compare the ratings of adults and children?
A)A z-statistic
B)A right one-tailed test statistic
C)A left one-tailed test statistic
D)A t-statistic
A)A z-statistic
B)A right one-tailed test statistic
C)A left one-tailed test statistic
D)A t-statistic
Unlock Deck
Unlock for access to all 122 flashcards in this deck.
Unlock Deck
k this deck
59
The results of a mathematics placement exam at two different campuses of Mercy College follow: What is the null hypothesis if we want to test the hypothesis that the mean score on Campus 1 is higher than on Campus 2?
A)H0: µ1 = 0
B)H0: µ2 = 0
C)H0: µ1 = µ2
D)H0: µ1 ≤ µ2
What is the null hypothesis if we want to test the hypothesis that the mean score on Campus 1 is higher than on Campus 2?A)H0: µ1 = 0
B)H0: µ2 = 0
C)H0: µ1 = µ2
D)H0: µ1 ≤ µ2
Unlock Deck
Unlock for access to all 122 flashcards in this deck.
Unlock Deck
k this deck
60
A company is researching the effectiveness of a new website design to decrease the time to access a website. Five website users were randomly selected, and their times (in seconds) to access the website with the old and new designs were recorded. To compare the times, they computed (new website design time - old website design time). The results follow. What is the alternative hypothesis?
A)H1: µd = 0
B)H1: µd ≠ 0
C)H1: µd > 0
D)H1: µd < 0
What is the alternative hypothesis?A)H1: µd = 0
B)H1: µd ≠ 0
C)H1: µd > 0
D)H1: µd < 0
Unlock Deck
Unlock for access to all 122 flashcards in this deck.
Unlock Deck
k this deck
61
The paired difference test has ___________ degrees of freedom.
Unlock Deck
Unlock for access to all 122 flashcards in this deck.
Unlock Deck
k this deck
62
When the population standard deviations are unknown, the purpose of pooling the sample variances when testing the difference between two populations is to ___________.
Unlock Deck
Unlock for access to all 122 flashcards in this deck.
Unlock Deck
k this deck
63
A company is researching the effectiveness of a new website design to decrease the time to access a website. Five website users were randomly selected, and their times (in seconds) to access the website with the old and new designs were recorded. To compare the times, they computed (new website design time - old website design time). The results follow. For a 0.01 significance level, what is the decision regarding the hypothesis that the training was effective in improving customer relationships?
A)Reject the null hypothesis and conclude that the new design reduced mean access times.
B)Reject the null hypothesis and conclude that the new design did not reduce mean access times.
C)Fail to reject the null hypothesis.
D)Fail to reject the null hypothesis and conclude that the mean access times are inaccurate.
For a 0.01 significance level, what is the decision regarding the hypothesis that the training was effective in improving customer relationships?A)Reject the null hypothesis and conclude that the new design reduced mean access times.
B)Reject the null hypothesis and conclude that the new design did not reduce mean access times.
C)Fail to reject the null hypothesis.
D)Fail to reject the null hypothesis and conclude that the mean access times are inaccurate.
Unlock Deck
Unlock for access to all 122 flashcards in this deck.
Unlock Deck
k this deck
64
When independent samples with unknown but equal standard deviations are used to test for differences in the means, we pool the sample _________________.
Unlock Deck
Unlock for access to all 122 flashcards in this deck.
Unlock Deck
k this deck
65
Accounting procedures allow a business to evaluate its inventory costs based on two methods: LIFO (Last In First Out) or FIFO (First In First Out). A manufacturer evaluated its finished goods inventory (in $000s) for five products with the LIFO and FIFO methods. To analyze the difference, they computed (FIFO - LIFO) for each product. Based on the following results, does the LIFO method result in a lower cost of inventory than the FIFO method? What is the value of calculated t?
A)+0.933
B)±2.776
C)+0.47
D)-2.028
What is the value of calculated t?A)+0.933
B)±2.776
C)+0.47
D)-2.028
Unlock Deck
Unlock for access to all 122 flashcards in this deck.
Unlock Deck
k this deck
66
When testing the hypothesized equality of two population means, the implied null hypothesis is ____________.
A)H0: µ1 = 0
B)H0: µ1 - µ2 = 0
C)H0: µ2 = 0
D)H0: µ1 - µ2 ≠ 0
A)H0: µ1 = 0
B)H0: µ1 - µ2 = 0
C)H0: µ2 = 0
D)H0: µ1 - µ2 ≠ 0
Unlock Deck
Unlock for access to all 122 flashcards in this deck.
Unlock Deck
k this deck
67
In one class, a statistics professor wants to compare grades on the first and second exams. This is an example of ________________ observations.
Unlock Deck
Unlock for access to all 122 flashcards in this deck.
Unlock Deck
k this deck
68
A company is researching the effectiveness of a new website design to decrease the time to access a website. Five website users were randomly selected, and their times (in seconds) to access the website with the old and new designs were recorded. To compare the times, they computed (new website design time - old website design time). The results follow. For a 0.01 significance level, what is the critical value?
A)2.256
B)1.895
C)3.747
D)2.447
For a 0.01 significance level, what is the critical value?A)2.256
B)1.895
C)3.747
D)2.447
Unlock Deck
Unlock for access to all 122 flashcards in this deck.
Unlock Deck
k this deck
69
If we are testing for the difference between two population means and assume that the two populations have equal and unknown standard deviations, the standard deviations are ______ to compute a point estimate of the population variance.
Unlock Deck
Unlock for access to all 122 flashcards in this deck.
Unlock Deck
k this deck
70
Accounting procedures allow a business to evaluate its inventory costs based on two methods: LIFO (Last In First Out) or FIFO (First In First Out). A manufacturer evaluated its finished goods inventory (in $000s) for five products with the LIFO and FIFO methods. To analyze the difference, they computed (FIFO - LIFO) for each product. Based on the following results, does the LIFO method result in a lower cost of inventory than the FIFO method? What is the decision at the 5% level of significance?
A)Fail to reject the null hypothesis and conclude LIFO is more effective.
B)Reject the null hypothesis and conclude LIFO is more effective.
C)Reject the alternate hypothesis and conclude LIFO is more effective.
D)Fail to reject the null hypothesis.
What is the decision at the 5% level of significance?A)Fail to reject the null hypothesis and conclude LIFO is more effective.
B)Reject the null hypothesis and conclude LIFO is more effective.
C)Reject the alternate hypothesis and conclude LIFO is more effective.
D)Fail to reject the null hypothesis.
Unlock Deck
Unlock for access to all 122 flashcards in this deck.
Unlock Deck
k this deck
71
If samples taken from two populations are dependent, then a test of ______ differences is applied.
Unlock Deck
Unlock for access to all 122 flashcards in this deck.
Unlock Deck
k this deck
72
The pooled estimate of the proportion is found by dividing the total number of successes by ___________________________.
Unlock Deck
Unlock for access to all 122 flashcards in this deck.
Unlock Deck
k this deck
73
When testing for a difference between the means of two dependent samples, n1 and n2 are ________________.
Unlock Deck
Unlock for access to all 122 flashcards in this deck.
Unlock Deck
k this deck
74
The purpose of pooling the sample proportions when testing the difference between two population proportions is to ___________.
Unlock Deck
Unlock for access to all 122 flashcards in this deck.
Unlock Deck
k this deck
75
If we are testing for the difference between two population proportions, it is assumed that the two samples are large enough that the binomial distribution can be approximated by ______.
Unlock Deck
Unlock for access to all 122 flashcards in this deck.
Unlock Deck
k this deck
76
Accounting procedures allow a business to evaluate their inventory costs based on two methods: LIFO (Last In First Out) or FIFO (First In First Out). A manufacturer evaluated its finished goods inventory (in $000s) for five products with the LIFO and FIFO methods. To analyze the difference, they computed (FIFO - LIFO) for each product. Based on the following results, does the LIFO method result in a lower cost of inventory than the FIFO method? What are the degrees of freedom?
A)4
B)5
C)15
D)10
What are the degrees of freedom?A)4
B)5
C)15
D)10
Unlock Deck
Unlock for access to all 122 flashcards in this deck.
Unlock Deck
k this deck
77
A company is researching the effectiveness of a new website design to decrease the time to access a website. Five website users were randomly selected, and their times (in seconds) to access the website with the old and new designs were recorded. To compare the times, they computed (new website design time - old website design time). The results follow. What is the value of the test statistic?
A)2.256
B)1.895
C)3.747
D)2.447
What is the value of the test statistic?A)2.256
B)1.895
C)3.747
D)2.447
Unlock Deck
Unlock for access to all 122 flashcards in this deck.
Unlock Deck
k this deck
78
Accounting procedures allow a business to evaluate its inventory costs based on two methods: LIFO (Last In First Out) or FIFO (First In First Out). A manufacturer evaluated its finished goods inventory (in $000s) for five products with the LIFO and FIFO methods. To analyze the difference, they computed (FIFO - LIFO) for each product. Based on the following results, does the LIFO method result in a lower cost of inventory than the FIFO method? This example is what type of test?
A)A one-sample test of means.
B)A two-sample test of means.
C)A paired t-test.
D)A test of proportions.
This example is what type of test?A)A one-sample test of means.
B)A two-sample test of means.
C)A paired t-test.
D)A test of proportions.
Unlock Deck
Unlock for access to all 122 flashcards in this deck.
Unlock Deck
k this deck
79
The paired t test is especially appropriate when the two samples are ________.
Unlock Deck
Unlock for access to all 122 flashcards in this deck.
Unlock Deck
k this deck
80
Accounting procedures allow a business to evaluate their inventory costs based on two methods: LIFO (Last In First Out) or FIFO (First In First Out). A manufacturer evaluated its finished goods inventory (in $000s) for five products with the LIFO and FIFO methods. To analyze the difference, they computed (FIFO - LIFO) for each product. Based on the following results, does the LIFO method result in a lower cost of inventory than the FIFO method? If you use the 5% level of significance, what is the critical t value?
A)+2.132
B)±2.132
C)+2.262
D)±2.228
If you use the 5% level of significance, what is the critical t value?A)+2.132
B)±2.132
C)+2.262
D)±2.228
Unlock Deck
Unlock for access to all 122 flashcards in this deck.
Unlock Deck
k this deck
Unlock Deck
Unlock for access to all 122 flashcards in this deck.


