Deck 6: The Beast of Bias
Full screen (f)
Question
Question
Question
Question
Question
Plot resting diastolic blood pressure as a histogram. You should get the histogram below. How would you describe its appearance? 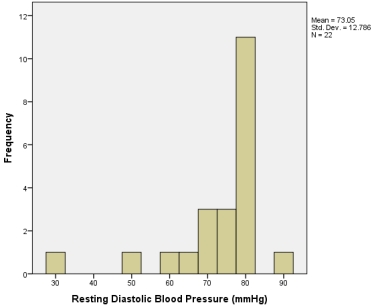
A) Normally distributed
B) Positively skewed
C) Negatively skewed
D) None of the descriptions represent the data expressed in the histogram
A) Normally distributed
B) Positively skewed
C) Negatively skewed
D) None of the descriptions represent the data expressed in the histogram
Question
Question
Question
Question
Question
Question
Question
Question
Question
Question
The following resting data were collected from three different sports teams (hockey, rugby and football). Ignoring the sports, plot a box-whisker plot for age, body mass, systolic blood pressure (SBP), diastolic blood pressure (DBP). Which variables does not have an outlier? (You may select more than one option.) 
A) Body mass
B) Age
C) Systolic blood pressure
D) Diastolic blood pressure
A) Body mass
B) Age
C) Systolic blood pressure
D) Diastolic blood pressure
Question
Question
Question
Question
Question
Question
Question
Question
Question
Question

Unlock Deck
Sign up to unlock the cards in this deck!
Unlock Deck
Unlock Deck
1/25
Play
Full screen (f)
Deck 6: The Beast of Bias
1
What assumption can be made regarding the distribution of the heart rate data?
A) They are not normally distributed.
B) They are normally distributed.
C) It is unclear whether they are normally distributed or not.
D) A Shapiro-Wilk test should be run to confirm the result.
A) They are not normally distributed.
B) They are normally distributed.
C) It is unclear whether they are normally distributed or not.
D) A Shapiro-Wilk test should be run to confirm the result.
B
2
Why does a Shapiro-Wilk test sometimes conclude that the data are not normally distributed (i.e. significant) when a Kolmogorov-Smirnov test is non-significant?
A) The Shapiro-Wilk test is more powerful.
B) The Shapiro-Wilk test is less powerful.
C) The Shapiro-Wilk test does not work well when there are a large number of cases.
D) The Shapiro-Wilk test is a more conservative test.
A) The Shapiro-Wilk test is more powerful.
B) The Shapiro-Wilk test is less powerful.
C) The Shapiro-Wilk test does not work well when there are a large number of cases.
D) The Shapiro-Wilk test is a more conservative test.
A
3
What assumption can be made regarding the distribution of the age data?
A) They are not normally distributed.
B) They are normally distributed.
C) It is unclear whether they are normally distributed or not.
D) A Shapiro-Wilk test should be run to confirm the result.
A) They are not normally distributed.
B) They are normally distributed.
C) It is unclear whether they are normally distributed or not.
D) A Shapiro-Wilk test should be run to confirm the result.
A
4
The z-score for the kurtosis or skewness of a data set can be considered significant if it falls between which range?
A) -1.96 and +1.96
B) -1.00 and +1.00
C) -2.62 and +2.62
D) -3.10 and +3.10
A) -1.96 and +1.96
B) -1.00 and +1.00
C) -2.62 and +2.62
D) -3.10 and +3.10
Unlock Deck
Unlock for access to all 25 flashcards in this deck.
Unlock Deck
k this deck
5
Plot resting diastolic blood pressure as a histogram. You should get the histogram below. How would you describe its appearance?
A) Normally distributed
B) Positively skewed
C) Negatively skewed
D) None of the descriptions represent the data expressed in the histogram
A) Normally distributed
B) Positively skewed
C) Negatively skewed
D) None of the descriptions represent the data expressed in the histogram
Unlock Deck
Unlock for access to all 25 flashcards in this deck.
Unlock Deck
k this deck
6
Split the data according to the sport. Run a Kolmogorov-Smirnov test on the diastolic blood pressure data. Which group's data cannot assume a normal distribution?
A) Football
B) Hockey
C) Rugby
D) All three are normally distributed.
A) Football
B) Hockey
C) Rugby
D) All three are normally distributed.
Unlock Deck
Unlock for access to all 25 flashcards in this deck.
Unlock Deck
k this deck
7
Sources of bias can be reduced if which of the following assumptions are met?
A) Additvity / linearity
B) Data are normally distributed
C) Homogeneity of variance
D) All of the above
A) Additvity / linearity
B) Data are normally distributed
C) Homogeneity of variance
D) All of the above
Unlock Deck
Unlock for access to all 25 flashcards in this deck.
Unlock Deck
k this deck
8
Which individual has had their stature expressed in centimetres as opposed to metres?
A) 22
B) 15
C) 11
D) 4
A) 22
B) 15
C) 11
D) 4
Unlock Deck
Unlock for access to all 25 flashcards in this deck.
Unlock Deck
k this deck
9
What is the correct expression for the Kolmogorov-Smirnov test for the systolic blood pressure data of the rugby players?
A) D(7) = .201, p > .2
B) D(7) = .201, p = .2
C) D(7) = .201, p < .2
D) D(7) = .2, p = .201
A) D(7) = .201, p > .2
B) D(7) = .201, p = .2
C) D(7) = .201, p < .2
D) D(7) = .2, p = .201
Unlock Deck
Unlock for access to all 25 flashcards in this deck.
Unlock Deck
k this deck
10
Calculate the z-score for the skewness of the resting heart rate data.
A) +0.5
B) -0.5
C) +1.5
D) -1.5
A) +0.5
B) -0.5
C) +1.5
D) -1.5
Unlock Deck
Unlock for access to all 25 flashcards in this deck.
Unlock Deck
k this deck
11
What does the X in Q1 refer to?
A) Predictor variable
B) Dependent variable
C) Regression coefficient
D) Correlation coefficient
A) Predictor variable
B) Dependent variable
C) Regression coefficient
D) Correlation coefficient
Unlock Deck
Unlock for access to all 25 flashcards in this deck.
Unlock Deck
k this deck
12
What does Levene's test do?
A) It tests the null hypothesis that the variances in different groups are equal.
B) It tests the research hypothesis that the variances in different groups are equal.
C) It tests the data to see whether they are normally distributed.
D) None of the above.
A) It tests the null hypothesis that the variances in different groups are equal.
B) It tests the research hypothesis that the variances in different groups are equal.
C) It tests the data to see whether they are normally distributed.
D) None of the above.
Unlock Deck
Unlock for access to all 25 flashcards in this deck.
Unlock Deck
k this deck
13
Use the compute function to create a new variable called mean arterial pressure (MAP). The equation you will need to enter is as follows: MAP = DBP+(0.333(SBP-DBP). Calculate the z-score for the kurtosis of the MAP data.
A) +7.18
B) -7.18
C) +1.28
D) -1.28
A) +7.18
B) -7.18
C) +1.28
D) -1.28
Unlock Deck
Unlock for access to all 25 flashcards in this deck.
Unlock Deck
k this deck
14
Calculate the z-score for the kurtosis of the resting heart rate data.
A) -0.6
B) +0.6
C) -1.6
D) +1.6
A) -0.6
B) +0.6
C) -1.6
D) +1.6
Unlock Deck
Unlock for access to all 25 flashcards in this deck.
Unlock Deck
k this deck
15
The following resting data were collected from three different sports teams (hockey, rugby and football). Ignoring the sports, plot a box-whisker plot for age, body mass, systolic blood pressure (SBP), diastolic blood pressure (DBP). Which variables does not have an outlier? (You may select more than one option.)
A) Body mass
B) Age
C) Systolic blood pressure
D) Diastolic blood pressure
A) Body mass
B) Age
C) Systolic blood pressure
D) Diastolic blood pressure
Unlock Deck
Unlock for access to all 25 flashcards in this deck.
Unlock Deck
k this deck
16
Statistical bias can affect which of the following statistical phenomena?
A) Effect sizes
B) Confidence intervals
C) p-values
D) All of the above
A) Effect sizes
B) Confidence intervals
C) p-values
D) All of the above
Unlock Deck
Unlock for access to all 25 flashcards in this deck.
Unlock Deck
k this deck
17
What does the central limit theorem state?
A) As sample size increases, the sample distribution better reflects the population distribution.
B) As sample size decreases, the sample distribution better reflects the population distribution.
C) As population size increases, the population distribution better reflects the sample distribution.
D) As population size decreases, the population distribution better reflects the sample distribution.
Unlock Deck
Unlock for access to all 25 flashcards in this deck.
Unlock Deck
k this deck
18
Ignoring the sport played, run a Kolmogorov-Smirnov test on the age variable. What is the correct expression for the result?
A) D(22) = .197, p = .026
B) D(22) = .026, p = .197
C) D(22) = .086, p > .2
D) D(22) = .2, p > .086
A) D(22) = .197, p = .026
B) D(22) = .026, p = .197
C) D(22) = .086, p > .2
D) D(22) = .2, p > .086
Unlock Deck
Unlock for access to all 25 flashcards in this deck.
Unlock Deck
k this deck
19
Which of the following equations best reflects a linear model?
A) outcomei = (b1X1) + errori *
B) outcomei = (b1 errori) * X1
C) outcomei = (b1X1) / errori
D) outcomei = (b1X1) × errori
A) outcomei = (b1X1) + errori *
B) outcomei = (b1 errori) * X1
C) outcomei = (b1X1) / errori
D) outcomei = (b1X1) × errori
Unlock Deck
Unlock for access to all 25 flashcards in this deck.
Unlock Deck
k this deck
20
Which of the following descriptions refers to statistical bias?
A) The error between individual observations and a statistical model
B) The degree of similarity between individual observations and a statistical model
C) The error between individual observations
D) The degree of similarity between statistical models
A) The error between individual observations and a statistical model
B) The degree of similarity between individual observations and a statistical model
C) The error between individual observations
D) The degree of similarity between statistical models
Unlock Deck
Unlock for access to all 25 flashcards in this deck.
Unlock Deck
k this deck
21
Which of the following does Hartley's Fmax refer to?
A) Variance ratio
B) Distribution of data
C) Measure scale used
D) Sphericity
A) Variance ratio
B) Distribution of data
C) Measure scale used
D) Sphericity
Unlock Deck
Unlock for access to all 25 flashcards in this deck.
Unlock Deck
k this deck
22
Compare the MAP variance of the three sports using Levene's test. What do the data suggest?
A) The three data sets have equal variance.
B) The three data sets have unequal variances.
C) The three data sets have nearly equal variance.
D) The result is unclear as the samples size of the three groups is too small.
A) The three data sets have equal variance.
B) The three data sets have unequal variances.
C) The three data sets have nearly equal variance.
D) The result is unclear as the samples size of the three groups is too small.
Unlock Deck
Unlock for access to all 25 flashcards in this deck.
Unlock Deck
k this deck
23
Calculate the z-score for the skewness of the resting heart rate data.
A) -4.6
B) +4.6
C) -0.6
D) +0.6
A) -4.6
B) +4.6
C) -0.6
D) +0.6
Unlock Deck
Unlock for access to all 25 flashcards in this deck.
Unlock Deck
k this deck
24
Based on the results for the skewness (Q21) and kurtosis (Q20) z-scores, which of the following descriptions best reflects the distribution assumptions of the MAP data?
A) Both the kurtosis and skewness z-scores are significant (i.e. not normally distributed).
B) Both the kurtosis and skewness z-scores are not significant (normally distributed).
C) The kurtosis z-score is significant, but the skewness z-score is not significant.
D) The skewness z-score is significant, but the kurtosis z-score is not significant.
Unlock Deck
Unlock for access to all 25 flashcards in this deck.
Unlock Deck
k this deck
25
Which of the following statements best describes bootstrapping?
A) Estimating the properties of the sampling distribution from the sample data.
B) Estimating the parameters of the population distribution from the population data.
C) Calculating the square root of the sample distribution statistic to predict the population distribution.
D) Calculating the log value of the sample distribution statistic to predict the population distribution.
Unlock Deck
Unlock for access to all 25 flashcards in this deck.
Unlock Deck
k this deck
Unlock Deck
Unlock for access to all 25 flashcards in this deck.


