Deck 1: Introduction to Statistics
Full screen (f)
Question
Question
Question
Question
Question
Question
Question
Question
Question
Question
Question
Question
Question
Question
Question
For the formula  ,if we let X = 361,the answer is
A)-19.00
B)19.00
C)180.50
D)130,321.00
,if we let X = 361,the answer isA)-19.00
B)19.00
C)180.50
D)130,321.00
Question
For X = 3.8,Y = 5,and Z = 2.5,find C. 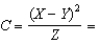
A)30.976
B)-0.48
C)0.48
D)0.576
A)30.976
B)-0.48
C)0.48
D)0.576
Question
Question
Question
Question
Question
Question
Question
Question
Question
Question
Question
Question
Question
Question
A)1/12
B)1.58
C)0.833
D)0.083
Question
Question
Question
Question
Question
Question
Question
Question
Question
Question
A)64.73
B)5,908.15
C)41,105.32
D)59,081.51
Question
Question
Question

Unlock Deck
Sign up to unlock the cards in this deck!
Unlock Deck
Unlock Deck
1/43
Play
Full screen (f)
Deck 1: Introduction to Statistics
1
The study of statistics will require you to
A)develop new formulas for statistical procedures.
B)learn how to compute and interpret statistical procedures correctly.
C)memorize many complicated and unfamiliar formulas.
D)learn a relatively unimportant step in conducting research.
A)develop new formulas for statistical procedures.
B)learn how to compute and interpret statistical procedures correctly.
C)memorize many complicated and unfamiliar formulas.
D)learn a relatively unimportant step in conducting research.
learn how to compute and interpret statistical procedures correctly.
2
The standardized code we use for mathematical operations,the order in which we perform operations,and the answers we obtain are referred to as
A)transformations.
B)data.
C)statistical notation.
D)rounding.
A)transformations.
B)data.
C)statistical notation.
D)rounding.
statistical notation.
3
Some of the answers we compute from statistical procedures are called
A)outcomes.
B)statistics.
C)data points.
D)computations.
A)outcomes.
B)statistics.
C)data points.
D)computations.
statistics.
4
Which of the following is not how you should learn statistics?
A)memorize and understand the terminology of statistics
B)make flash cards for each of the key terms
C)skim the material in the textbook and then try to do the problems
D)work the problems at the end of each chapter
A)memorize and understand the terminology of statistics
B)make flash cards for each of the key terms
C)skim the material in the textbook and then try to do the problems
D)work the problems at the end of each chapter
Unlock Deck
Unlock for access to all 43 flashcards in this deck.
Unlock Deck
k this deck
5
If X = 8 and Y = 10,then X -Y equals
A)18.00
B)2.00
C)-18.00
D)-2.00
A)18.00
B)2.00
C)-18.00
D)-2.00
Unlock Deck
Unlock for access to all 43 flashcards in this deck.
Unlock Deck
k this deck
6
A statistics instructor asks the students to rate how well they like math.The instructor will use statistics to
A)organize,transform,perform mathematical operations,and otherwise manipulate the students' ratings.
B)design a research study looking at students' liking of math.
C)round the ratings to two decimal places so that they are more easily communicated.
D)organize,summarize,communicate,and draw conclusions about the students' ratings.
Unlock Deck
Unlock for access to all 43 flashcards in this deck.
Unlock Deck
k this deck
7
The word empirical refers to
A)organizing and summarizing.
B)knowledge gained from theory.
C)predictions based on theory.
D)knowledge obtained through observation and measurement.
A)organizing and summarizing.
B)knowledge gained from theory.
C)predictions based on theory.
D)knowledge obtained through observation and measurement.
Unlock Deck
Unlock for access to all 43 flashcards in this deck.
Unlock Deck
k this deck
8
In standard statistical notation,X and Y are used to stand for
A)each individual score obtained in a study.
B)instructions to multiply or divide in a formula.
C)instructions to add or subtract in a formula.
D)summary statistics such as sums or means.
A)each individual score obtained in a study.
B)instructions to multiply or divide in a formula.
C)instructions to add or subtract in a formula.
D)summary statistics such as sums or means.
Unlock Deck
Unlock for access to all 43 flashcards in this deck.
Unlock Deck
k this deck
9
Empirical research involves measurement.Such measurement results in numbers or scores.These scores usually are referred to as
A)data.
B)hypotheses.
C)statistics.
D)conclusions.
A)data.
B)hypotheses.
C)statistics.
D)conclusions.
Unlock Deck
Unlock for access to all 43 flashcards in this deck.
Unlock Deck
k this deck
10
Statistics is a shortened version of
A)statistical procedures.
B)statistical data.
C)statistical mathematics.
D)statistical proof.
A)statistical procedures.
B)statistical data.
C)statistical mathematics.
D)statistical proof.
Unlock Deck
Unlock for access to all 43 flashcards in this deck.
Unlock Deck
k this deck
11
While statistical software such as SPSS is a useful tool,you will still need to
A)memorize all formulas in the text.
B)know when to use each statistic and what the answer means.
C)understand the mathematical theory behind every procedure.
D)develop outstanding mathematical skills.
A)memorize all formulas in the text.
B)know when to use each statistic and what the answer means.
C)understand the mathematical theory behind every procedure.
D)develop outstanding mathematical skills.
Unlock Deck
Unlock for access to all 43 flashcards in this deck.
Unlock Deck
k this deck
12
When working the problems at the end of each chapter,you should
A)always look at the answers in the back of the book first.
B)never look at the answers in the back of the book.
C)use a computer program such as SPSS to check all your answers.
D)really try to solve each problem and then look at the answer in the back of the book.
A)always look at the answers in the back of the book first.
B)never look at the answers in the back of the book.
C)use a computer program such as SPSS to check all your answers.
D)really try to solve each problem and then look at the answer in the back of the book.
Unlock Deck
Unlock for access to all 43 flashcards in this deck.
Unlock Deck
k this deck
13
When two components are placed next to each other,such as XY,it means
A)add the two components.
B)subtract the second component from the first component.
C)multiply the two components.
D)divide the second component into the first component.
A)add the two components.
B)subtract the second component from the first component.
C)multiply the two components.
D)divide the second component into the first component.
Unlock Deck
Unlock for access to all 43 flashcards in this deck.
Unlock Deck
k this deck
14
When performing mathematical operations,unless otherwise indicated,which operation should you perform first?
A)multiplication or division
B)squaring or taking the square root
C)addition or subtraction
D)anything inside of parentheses
A)multiplication or division
B)squaring or taking the square root
C)addition or subtraction
D)anything inside of parentheses
Unlock Deck
Unlock for access to all 43 flashcards in this deck.
Unlock Deck
k this deck
15
For the formula ,if we let X = 361,the answer is
A)-19.00
B)19.00
C)180.50
D)130,321.00
,if we let X = 361,the answer isA)-19.00
B)19.00
C)180.50
D)130,321.00
Unlock Deck
Unlock for access to all 43 flashcards in this deck.
Unlock Deck
k this deck
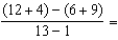
16
For X = 3.8,Y = 5,and Z = 2.5,find C.
A)30.976
B)-0.48
C)0.48
D)0.576
A)30.976
B)-0.48
C)0.48
D)0.576
Unlock Deck
Unlock for access to all 43 flashcards in this deck.
Unlock Deck
k this deck
17
Learning statistics may be most closely compared with
A)learning a new language.
B)learning how to use a computer.
C)learning how to compute complex mathematics.
D)learning how to paint a picture.
A)learning a new language.
B)learning how to use a computer.
C)learning how to compute complex mathematics.
D)learning how to paint a picture.
Unlock Deck
Unlock for access to all 43 flashcards in this deck.
Unlock Deck
k this deck
18
For the formula P + Q,if we let P = 9 and Q = 13,the answer is
A)-4.00
B)0.69
C)1.44
D)22.00
A)-4.00
B)0.69
C)1.44
D)22.00
Unlock Deck
Unlock for access to all 43 flashcards in this deck.
Unlock Deck
k this deck
19
For the formula PQ,if we let P = 11 and Q = -6,the answer is
A)66.00
B)5
C)-66.00
D)-1.833
A)66.00
B)5
C)-66.00
D)-1.833
Unlock Deck
Unlock for access to all 43 flashcards in this deck.
Unlock Deck
k this deck
20
For the formula P/Q,if we let P = 12 and Q = 4,the answer is
A)1/3
B)0.33
C)3.00
D)3/1
A)1/3
B)0.33
C)3.00
D)3/1
Unlock Deck
Unlock for access to all 43 flashcards in this deck.
Unlock Deck
k this deck
21
Of the 63 individuals who participated in a research study,23 had blue eyes,37 had brown eyes,and 3 had green eyes.What percentage of the people had brown eyes?
A)0.5873
B)58.73
C)37
D)5.873
A)0.5873
B)58.73
C)37
D)5.873
Unlock Deck
Unlock for access to all 43 flashcards in this deck.
Unlock Deck
k this deck
22
For the formula [5(3)- 3],the answer is
A)0.00
B)12.00
C)18.00
D)45.00
A)0.00
B)12.00
C)18.00
D)45.00
Unlock Deck
Unlock for access to all 43 flashcards in this deck.
Unlock Deck
k this deck
23
If your final answer should contain two decimal places,then in the intermediate steps you should
A)carry at least three decimal places.
B)round to the same number of decimal places as your final answer will contain.
C)round to the same number of decimal places as the original scores contained.
D)round to whole numbers.
A)carry at least three decimal places.
B)round to the same number of decimal places as your final answer will contain.
C)round to the same number of decimal places as the original scores contained.
D)round to whole numbers.
Unlock Deck
Unlock for access to all 43 flashcards in this deck.
Unlock Deck
k this deck
24
An instructor counts how many women and men there are in the class and transforms the numbers into percent.The calculator reads 75.757575% women and 24.242424% men.These final answers should be rounded to
A)75.75% and 24.24%
B)75.76% and 24.24%
C)75.7% and 24.2%
D)75.758% and 24.242%
A)75.75% and 24.24%
B)75.76% and 24.24%
C)75.7% and 24.2%
D)75.758% and 24.242%
Unlock Deck
Unlock for access to all 43 flashcards in this deck.
Unlock Deck
k this deck
25
Always carry out your calculations so that your final answer after rounding has how many more decimal places than the original scores?
A)0
B)1
C)2
D)3
A)0
B)1
C)2
D)3
Unlock Deck
Unlock for access to all 43 flashcards in this deck.
Unlock Deck
k this deck
26
For any graph,whenever there is a large gap between 0 and the lowest score you are plotting,the axis is compressed using
A)unequal spacing on the labels.
B)// (two diagonal lines).
C)a gap on the X axis where it meets the Y axis.
D)very small print and equal spacing on the axis.
A)unequal spacing on the labels.
B)// (two diagonal lines).
C)a gap on the X axis where it meets the Y axis.
D)very small print and equal spacing on the axis.
Unlock Deck
Unlock for access to all 43 flashcards in this deck.
Unlock Deck
k this deck
27
If we convert the percentage 45.78% to a proportion,we get
A)0.4578
B)4.578
C)45.78
D)457.8
A)0.4578
B)4.578
C)45.78
D)457.8
Unlock Deck
Unlock for access to all 43 flashcards in this deck.
Unlock Deck
k this deck
28
A decimal number between 0 and 1 that indicates a fraction of the total is called a
A)percentage.
B)proportion.
C)data point.
D)statistical procedure.
A)percentage.
B)proportion.
C)data point.
D)statistical procedure.
Unlock Deck
Unlock for access to all 43 flashcards in this deck.
Unlock Deck
k this deck
29
For a statistics lab assignment,you must earn 75% of the points to pass an assignment worth 60 points.What score must you obtain to pass it?
A)0.80
B)1.25
C)40
D)45
A)0.80
B)1.25
C)40
D)45
Unlock Deck
Unlock for access to all 43 flashcards in this deck.
Unlock Deck
k this deck
30
A)1/12
B)1.58
C)0.833
D)0.083
Unlock Deck
Unlock for access to all 43 flashcards in this deck.
Unlock Deck
k this deck
31
If we perform a square transformation on the numbers 3,6,9,12,and 15,we get
A)9,36,81,144,and 225
B)6,12,18,24,and 30
C)45.00
D)1.7321,2.4495,3.0000,3.4641,3.8730
A)9,36,81,144,and 225
B)6,12,18,24,and 30
C)45.00
D)1.7321,2.4495,3.0000,3.4641,3.8730
Unlock Deck
Unlock for access to all 43 flashcards in this deck.
Unlock Deck
k this deck
32
One reason we transform data is to
A)create data that are positive numbers.
B)create data that are whole numbers.
C)make the data easier to work with.
D)eliminate inappropriate data.
A)create data that are positive numbers.
B)create data that are whole numbers.
C)make the data easier to work with.
D)eliminate inappropriate data.
Unlock Deck
Unlock for access to all 43 flashcards in this deck.
Unlock Deck
k this deck
33
Changing a set of raw scores indicating the number of correct answers on a test into the proportion or percent correct is an example of
A)lying with statistics.
B)rounding.
C)graphing data.
D)a transformation.
A)lying with statistics.
B)rounding.
C)graphing data.
D)a transformation.
Unlock Deck
Unlock for access to all 43 flashcards in this deck.
Unlock Deck
k this deck
34
On the Y axis of any graph,as we move up the axis,the scores become
A)larger positive.
B)smaller negative.
C)larger negative.
D)smaller positive.
A)larger positive.
B)smaller negative.
C)larger negative.
D)smaller positive.
Unlock Deck
Unlock for access to all 43 flashcards in this deck.
Unlock Deck
k this deck
35
If we transform the set of scores 5,8,11,and 15 by multiplying by 2 and adding 10,we are using the formula Y = (2)X + 10.The resulting set of scores would be
A)20,26,32,and 40
B)30,36,42,and 50
C)88
D)70,100,130,and 170
A)20,26,32,and 40
B)30,36,42,and 50
C)88
D)70,100,130,and 170
Unlock Deck
Unlock for access to all 43 flashcards in this deck.
Unlock Deck
k this deck
36
Each "dot" on a graph is referred to as a(n)
A)data point.
B)score.
C)score intersection.
D)axis.
A)data point.
B)score.
C)score intersection.
D)axis.
Unlock Deck
Unlock for access to all 43 flashcards in this deck.
Unlock Deck
k this deck
37
On the X axis of any graph,as we move to the right,the scores become
A)larger positive.
B)smaller negative.
C)larger negative.
D)smaller positive.
A)larger positive.
B)smaller negative.
C)larger negative.
D)smaller positive.
Unlock Deck
Unlock for access to all 43 flashcards in this deck.
Unlock Deck
k this deck
38
If we convert the percentage 0.05% to a proportion,we get
A)0.50
B)0.05
C)0.005
D)0.0005
A)0.50
B)0.05
C)0.005
D)0.0005
Unlock Deck
Unlock for access to all 43 flashcards in this deck.
Unlock Deck
k this deck
39
If we convert the proportion .097 to a percentage,we get
A)0.097 %
B)0.97%
C)9.7%
D)97%
A)0.097 %
B)0.97%
C)9.7%
D)97%
Unlock Deck
Unlock for access to all 43 flashcards in this deck.
Unlock Deck
k this deck
40
A)64.73
B)5,908.15
C)41,105.32
D)59,081.51
Unlock Deck
Unlock for access to all 43 flashcards in this deck.
Unlock Deck
k this deck
41
If you were to graph the following data,which of the following series of labels would produce a graph that best represents the data? Hours Studied
Exam Score
1
70
2
79
3
86
5
98
A)1,2,3,5 on the X axis;70,80,90,100 on the Y axis
B)1,2,3,4,5 on the X axis;70,80,90,100 on the Y axis
C)1,2,3,4,5 on the X axis;20,40,60,80,100 on the Y axis
D)1,2,3,5 on the X axis;20,40,60,80,100 on the Y axis
Exam Score
1
70
2
79
3
86
5
98
A)1,2,3,5 on the X axis;70,80,90,100 on the Y axis
B)1,2,3,4,5 on the X axis;70,80,90,100 on the Y axis
C)1,2,3,4,5 on the X axis;20,40,60,80,100 on the Y axis
D)1,2,3,5 on the X axis;20,40,60,80,100 on the Y axis
Unlock Deck
Unlock for access to all 43 flashcards in this deck.
Unlock Deck
k this deck
42
In creating any graph,it is important to make the spacing between the labels identifying the scores on an axis
A)reflect the spacing between the actual scores.
B)equal in all cases.
C)unequal in all cases.
D)reflect the pattern you want the scores to show.
A)reflect the spacing between the actual scores.
B)equal in all cases.
C)unequal in all cases.
D)reflect the pattern you want the scores to show.
Unlock Deck
Unlock for access to all 43 flashcards in this deck.
Unlock Deck
k this deck
43
In any graph,the axes should be labeled in a way that
A)enhances or exaggerates the pattern formed.
B)minimizes the pattern formed.
C)always equally spaces the data points.
D)honestly presents the data.
A)enhances or exaggerates the pattern formed.
B)minimizes the pattern formed.
C)always equally spaces the data points.
D)honestly presents the data.
Unlock Deck
Unlock for access to all 43 flashcards in this deck.
Unlock Deck
k this deck
Unlock Deck
Unlock for access to all 43 flashcards in this deck.


