Deck 14: Statistical Methods for Quality Control
Full screen (f)
Question
Question
Question
Question
Question
Question
Question
Question
Question
Question
Question
Question
Question
Question
Question
Question
Question
Question
Question
Question
Question
Question
Question
Question
Question
Question
Question
Question
Question
Question
Question
Question
Question
Question
Question
Question
Question
Question
Question
Question
Question
Question
Question
The following data represent the filling weights based on samples of 14.5 ounce cans of whole peeled tomatoes. Ten samples of size 5 were taken. Use Excel to develop an x-bar chart.

Question
Question
Question
Question
Question
Question
Question
Question
The following data represent the filling weights based on samples of 14.5 ounce cans of whole peeled tomatoes. Ten samples of size 5 were taken. Use Excel to develop an R chart.

Question
Question
Question
Question
Question
Question
Question
The following data represent the filling weights based on samples of 350-gram containers. Ten samples of size 5 were taken. Use Excel to develop an R chart.

Question
Question
The following data represent the filling weights based on samples of 350-gram containers. Ten samples of size 5 were taken. Use Excel to develop an x-bar chart.

Question
Harry Coates wants to construct  and R charts at the bag-filling operation for Meow Chow cat food. He knows that when the filling operation is functioning correctly, bags of cat food should average 50.00 pounds and 5-bag samples should have an average range of .330 pounds.
Harry had twenty 5-bag samples taken at 2-hour intervals and the sample means and ranges are shown below. Determine the center lines and upper and lower control limits for the and R charts.
and R charts at the bag-filling operation for Meow Chow cat food. He knows that when the filling operation is functioning correctly, bags of cat food should average 50.00 pounds and 5-bag samples should have an average range of .330 pounds.Harry had twenty 5-bag samples taken at 2-hour intervals and the sample means and ranges are shown below. Determine the center lines and upper and lower control limits for the
and R charts. Question
Question
Janie Hochevar, director of production at the center, has decided to record the number of defective labels in random daily samples on control charts. Janie estimates that 1.5 percent loose labels is typical when the labeling process is in control.
Twelve daily samples, each consisting of 200 pairs of jeans, were selected and examined. The number of defective labels found in each sample is shown below.

a. Determine the center line and the 3s control limits for the p chart.
b. Decide if the labeling operation is in control.
Twelve daily samples, each consisting of 200 pairs of jeans, were selected and examined. The number of defective labels found in each sample is shown below.
a. Determine the center line and the 3s control limits for the p chart.
b. Decide if the labeling operation is in control.
Question
The weight of bags of cement filled by Granite Rock Company's packaging process is normally distributed with a mean of 50 pounds and a standard deviation of 1.5 pounds when the process is in control. What should the control limits be for a sample mean,  , chart if 9 bags are sampled at a time?
, chart if 9 bags are sampled at a time? Question
Question
The No-Cal Bottling Company bottles soft drinks for sale to government commissaries. The bottles come in only one flavor (chocolate-lemon) and only one size (32 ounces). Joan Stickler, the quality control officer for the commissaries, wants to keep track of the fill weights of No-Cal and begins to draw daily samples of 100 bottles from the daily receipts. The first ten sample means and ranges are:
 If sample ranges ordinarily average 2.5 ounces:
a. Compute 3s control limits for sample means.
b. Compute 3s control limits for sample ranges.
c. What would you conclude about the fill weights of NoCal?
If sample ranges ordinarily average 2.5 ounces: a. Compute 3s control limits for sample means.
b. Compute 3s control limits for sample ranges.
c. What would you conclude about the fill weights of NoCal?
Question
Question
Question
Question
Question
Question
A process sampled 30 times with a sample of size nine resulted in  = 12.7 and
  = 0.8. Compute the upper and lower control limits for the
  and
and  charts for this process.
= 12.7 and = 0.8. Compute the upper and lower control limits for the and charts for this process.
Unlock Deck
Sign up to unlock the cards in this deck!
Unlock Deck
Unlock Deck
1/72
Play
Full screen (f)
Deck 14: Statistical Methods for Quality Control
1
A control chart that is used when the output of a production process is measured in terms of the proportion defective is
A)a p chart
B)an x-bar chart
C)an R chart
D)an np chart
A)a p chart
B)an x-bar chart
C)an R chart
D)an np chart
a p chart
2
Normal or natural variation in the quality of production output that is due purely to chance is called
A)common-cause variation
B)assignable-cause variation
C)control-cause variation
D)correctable-cause variation
A)common-cause variation
B)assignable-cause variation
C)control-cause variation
D)correctable-cause variation
common-cause variation
3
The sample result plotted on an np control chart is
A)np
B)np
C)the number of perfect units in the sample
D)the number of defective units in the sample
A)np
B)np
C)the number of perfect units in the sample
D)the number of defective units in the sample
the number of defective units in the sample
4
A control chart that is used to monitor the range of the measurements in a sample is
A)a p chart
B)an x-bar chart
C)an R chart
D)an np chart
A)a p chart
B)an x-bar chart
C)an R chart
D)an np chart
Unlock Deck
Unlock for access to all 72 flashcards in this deck.
Unlock Deck
k this deck
5
Quality assurance consists of
A)quality control
B)quality engineering
C)quality assurance
D)Both quality control and quality engineering are correct.
A)quality control
B)quality engineering
C)quality assurance
D)Both quality control and quality engineering are correct.
Unlock Deck
Unlock for access to all 72 flashcards in this deck.
Unlock Deck
k this deck
6
A control chart used when the output of a process is measured in terms of the mean value of a variable such as a length, weight, temperature, and so on is
A)a p chart
B)an x-bar chart
C)an R chart
D)an np chart
A)a p chart
B)an x-bar chart
C)an R chart
D)an np chart
Unlock Deck
Unlock for access to all 72 flashcards in this deck.
Unlock Deck
k this deck
7
Variation in the quality of production output that is due to factors such as machine tools wearing out is called
A)common-cause variation
B)assignable-cause variation
C)acceptable-cause variation
D)natural-cause variation
A)common-cause variation
B)assignable-cause variation
C)acceptable-cause variation
D)natural-cause variation
Unlock Deck
Unlock for access to all 72 flashcards in this deck.
Unlock Deck
k this deck
8
A control chart that is used to monitor the number of defectives in a sample is
A)a p chart
B)an x-bar chart
C)an R chart
D)an np chart
A)a p chart
B)an x-bar chart
C)an R chart
D)an np chart
Unlock Deck
Unlock for access to all 72 flashcards in this deck.
Unlock Deck
k this deck
9
If the value of c in a single-stage acceptance sampling plan is increased, with n remaining constant, the probability of accepting the lot
A)increases
B)decreases
C)remains the same
D)might increase or decrease, depending on the percent defective in the lot
A)increases
B)decreases
C)remains the same
D)might increase or decrease, depending on the percent defective in the lot
Unlock Deck
Unlock for access to all 72 flashcards in this deck.
Unlock Deck
k this deck
10
The entire system of policies, procedures, and guidelines established by an organization to achieve and maintain quality is called
A)quality control
B)quality engineering
C)quality assurance
D)Both quality control and quality engineering are correct.
A)quality control
B)quality engineering
C)quality assurance
D)Both quality control and quality engineering are correct.
Unlock Deck
Unlock for access to all 72 flashcards in this deck.
Unlock Deck
k this deck
11
An operating characteristic curve is based on a ________ probability distribution.
A)normal
B)exponential
C)binomial
D)uniform
A)normal
B)exponential
C)binomial
D)uniform
Unlock Deck
Unlock for access to all 72 flashcards in this deck.
Unlock Deck
k this deck
12
Control charts that are based on data indicating the presence of a defect or the number of defects are called ______ control charts.
A)attributes
B)variables
C)common-cause
D)assignable-cause
A)attributes
B)variables
C)common-cause
D)assignable-cause
Unlock Deck
Unlock for access to all 72 flashcards in this deck.
Unlock Deck
k this deck
13
Which of the following is not a type of a control chart?
A)a p chart
B)an x-bar chart
C)an R chart
D)All of these are types of control charts.
A)a p chart
B)an x-bar chart
C)an R chart
D)All of these are types of control charts.
Unlock Deck
Unlock for access to all 72 flashcards in this deck.
Unlock Deck
k this deck
14
__________ consist(s) of making a series of inspections and measurements to determine whether quality standards are being met.
A)Quality control
B)Quality engineering
C)Quality assurance
D)Both quality control and quality engineering are correct.
A)Quality control
B)Quality engineering
C)Quality assurance
D)Both quality control and quality engineering are correct.
Unlock Deck
Unlock for access to all 72 flashcards in this deck.
Unlock Deck
k this deck
15
The control limits for a p chart are how many standard deviations above and below the proportion defective?
A)one
B)two
C)three
D)four
A)one
B)two
C)three
D)four
Unlock Deck
Unlock for access to all 72 flashcards in this deck.
Unlock Deck
k this deck
16
The control limits for an x-bar chart are how many standard deviations above and below the process mean?
A)one
B)two
C)three
D)four
A)one
B)two
C)three
D)four
Unlock Deck
Unlock for access to all 72 flashcards in this deck.
Unlock Deck
k this deck
17
The general practice in quality control is to set the control chart's upper and lower control limit values equal to the variable's mean value +/-
A)1 standard deviation
B)2 standard deviations
C)2.5 standard deviations
D)3 standard deviations
A)1 standard deviation
B)2 standard deviations
C)2.5 standard deviations
D)3 standard deviations
Unlock Deck
Unlock for access to all 72 flashcards in this deck.
Unlock Deck
k this deck
18
A graphical tool used to help determine whether a process is in control or out of control is a
A)scatter diagram
B)histogram
C)control chart
D)None of the other answers is correct.
A)scatter diagram
B)histogram
C)control chart
D)None of the other answers is correct.
Unlock Deck
Unlock for access to all 72 flashcards in this deck.
Unlock Deck
k this deck
19
Which of the following is a statistical method used in quality control?
A)statistical process control
B)acceptance sampling
C)Both statistical process control and acceptance sampling are correct.
D)None of the other answers is correct.
A)statistical process control
B)acceptance sampling
C)Both statistical process control and acceptance sampling are correct.
D)None of the other answers is correct.
Unlock Deck
Unlock for access to all 72 flashcards in this deck.
Unlock Deck
k this deck
20
If the calculated lower-control limit of a p chart is negative,
A)a mistake has been made in the calculations
B)use the absolute value of the lower limit
C)it is set to zero
D)None of the other answers is correct.
A)a mistake has been made in the calculations
B)use the absolute value of the lower limit
C)it is set to zero
D)None of the other answers is correct.
Unlock Deck
Unlock for access to all 72 flashcards in this deck.
Unlock Deck
k this deck
21
In contrast to Deming's philosophy, which required a major cultural change in the organization, Juran's programs were designed to improve quality by
A)working within the current organizational system
B)reducing the number of levels in the organizational structure
C)changing customer perception and expectations
D)identifying and replacing the most counter-productive employees
A)working within the current organizational system
B)reducing the number of levels in the organizational structure
C)changing customer perception and expectations
D)identifying and replacing the most counter-productive employees
Unlock Deck
Unlock for access to all 72 flashcards in this deck.
Unlock Deck
k this deck
22
Rejecting a poor-quality lot would be a
A)Type I error
B)Type II error
C)correct decision
D)None of the other answers is correct.
A)Type I error
B)Type II error
C)correct decision
D)None of the other answers is correct.
Unlock Deck
Unlock for access to all 72 flashcards in this deck.
Unlock Deck
k this deck
23
In acceptance sampling, the risk of rejecting a good quality lot is known as
A)consumer's risk
B)producer's risk
C)a Type II error
D)None of the other answers is correct
A)consumer's risk
B)producer's risk
C)a Type II error
D)None of the other answers is correct
Unlock Deck
Unlock for access to all 72 flashcards in this deck.
Unlock Deck
k this deck
24
DFSS stands for
A)Defects Found Sifting and Sorting
B)Design For Six Sigma
C)Deviation From Specifications and Standards
D)Defer For Statistical Study
A)Defects Found Sifting and Sorting
B)Design For Six Sigma
C)Deviation From Specifications and Standards
D)Defer For Statistical Study
Unlock Deck
Unlock for access to all 72 flashcards in this deck.
Unlock Deck
k this deck
25
The control limits for an np chart are how many standard deviations above and below the expected number of defectives?
A)one
B)two
C)three
D)four
A)one
B)two
C)three
D)four
Unlock Deck
Unlock for access to all 72 flashcards in this deck.
Unlock Deck
k this deck
26
When a Motorola executive said "That evaluation is …. perhaps the most cost-effective, value-added business consultation available anywhere in the world today" he was referring to
A)ISO 9000 standards
B)the Six Sigma philosophy
C)Deming's 14 Points
D)the Malcolm Baldrige Quality Award
A)ISO 9000 standards
B)the Six Sigma philosophy
C)Deming's 14 Points
D)the Malcolm Baldrige Quality Award
Unlock Deck
Unlock for access to all 72 flashcards in this deck.
Unlock Deck
k this deck
27
Consumer's risk is
A)the same concept as the producer's risk
B)a Type II error
C)a Type I error
D)None of the other answers is correct.
A)the same concept as the producer's risk
B)a Type II error
C)a Type I error
D)None of the other answers is correct.
Unlock Deck
Unlock for access to all 72 flashcards in this deck.
Unlock Deck
k this deck
28
A graph showing the probability of accepting the lot as a function of the percent defective in the lot is
A)a power curve
B)a control chart
C)an operating characteristic curve
D)None of the other answers is correct.
A)a power curve
B)a control chart
C)an operating characteristic curve
D)None of the other answers is correct.
Unlock Deck
Unlock for access to all 72 flashcards in this deck.
Unlock Deck
k this deck
29
A form of acceptance sampling in which more than one sample or stage is used is called a
A)single-sample plan
B)multiple-sampling plan
C)multinomial sampling plan
D)None of the other answers is correct.
A)single-sample plan
B)multiple-sampling plan
C)multinomial sampling plan
D)None of the other answers is correct.
Unlock Deck
Unlock for access to all 72 flashcards in this deck.
Unlock Deck
k this deck
30
The maximum number of defective items that can be found in the sample and still lead to acceptance of the lot is
A)the upper control limit
B)the lower control limit
C)the acceptance criterion
D)None of the other answers is correct.
A)the upper control limit
B)the lower control limit
C)the acceptance criterion
D)None of the other answers is correct.
Unlock Deck
Unlock for access to all 72 flashcards in this deck.
Unlock Deck
k this deck
31
A group of items such as incoming shipments of raw material is called
A)a sample plan
B)an incoming control
C)a lot
D)None of the other answers is correct.
A)a sample plan
B)an incoming control
C)a lot
D)None of the other answers is correct.
Unlock Deck
Unlock for access to all 72 flashcards in this deck.
Unlock Deck
k this deck
32
Accepting a good-quality lot would be a
A)Type I error
B)Type II error
C)correct decision
D)None of the other answers is correct.
A)Type I error
B)Type II error
C)correct decision
D)None of the other answers is correct.
Unlock Deck
Unlock for access to all 72 flashcards in this deck.
Unlock Deck
k this deck
33
In acceptance sampling, the risk of accepting a poor quality lot is known as
A)consumer's risk
B)producer's risk
C)a Type I error
D)None of the other answers is correct.
A)consumer's risk
B)producer's risk
C)a Type I error
D)None of the other answers is correct.
Unlock Deck
Unlock for access to all 72 flashcards in this deck.
Unlock Deck
k this deck
34
Juran proposed a simple definition of quality:
A)customer satisfaction
B)conformance to specifications
C)fitness for use
D)commitment to excellence
A)customer satisfaction
B)conformance to specifications
C)fitness for use
D)commitment to excellence
Unlock Deck
Unlock for access to all 72 flashcards in this deck.
Unlock Deck
k this deck
35
Six Sigma represents a quality level of at most ____ defects per million opportunities.
A)3.4
B)6.0
C)19.7
D)99.5
A)3.4
B)6.0
C)19.7
D)99.5
Unlock Deck
Unlock for access to all 72 flashcards in this deck.
Unlock Deck
k this deck
36
The Malcolm Baldrige National Quality Award was established in
A)1954
B)1971
C)1987
D)1993
A)1954
B)1971
C)1987
D)1993
Unlock Deck
Unlock for access to all 72 flashcards in this deck.
Unlock Deck
k this deck
37
A statistical procedure in which the number of defective items found in a sample is used to determine whether a lot should be accepted or rejected is called
A)statistical process control
B)acceptance sampling
C)quality assurance
D)control charts
A)statistical process control
B)acceptance sampling
C)quality assurance
D)control charts
Unlock Deck
Unlock for access to all 72 flashcards in this deck.
Unlock Deck
k this deck
38
Producer's risk is
A)the same as the consumer's risk
B)a Type II error
C)a Type I error
D)None of the other answers is correct.
A)the same as the consumer's risk
B)a Type II error
C)a Type I error
D)None of the other answers is correct.
Unlock Deck
Unlock for access to all 72 flashcards in this deck.
Unlock Deck
k this deck
39
The second stage of a two-stage acceptance sampling plan is executed when the first-stage result is
A)x1 > c1
B)c1 < x1 < c2
C)x1 > c2
D)x1 > c1 + c2
A)x1 > c1
B)c1 < x1 < c2
C)x1 > c2
D)x1 > c1 + c2
Unlock Deck
Unlock for access to all 72 flashcards in this deck.
Unlock Deck
k this deck
40
The three quality processes on which Juran's approach to quality focused include all of the following except
A)quality planning
B)quality execution
C)quality control
D)quality improvement
A)quality planning
B)quality execution
C)quality control
D)quality improvement
Unlock Deck
Unlock for access to all 72 flashcards in this deck.
Unlock Deck
k this deck
41
A production process that is in control has a mean ( ) of 80 and a standard deviation ( ) of 10.
a.Determine the upper and the lower control limits for sample sizes of 25.
b.Five samples had means of 81, 84, 75, 83, and 79. Construct an x-bar chart and explain whether or not the process is in control.
a.Determine the upper and the lower control limits for sample sizes of 25.
b.Five samples had means of 81, 84, 75, 83, and 79. Construct an x-bar chart and explain whether or not the process is in control.
Unlock Deck
Unlock for access to all 72 flashcards in this deck.
Unlock Deck
k this deck
42
The two general classifications of attributes in quality control are
A)random and predictable
B)controllable and uncontrollable
C)variable and constant
D)defective and nondefective
A)random and predictable
B)controllable and uncontrollable
C)variable and constant
D)defective and nondefective
Unlock Deck
Unlock for access to all 72 flashcards in this deck.
Unlock Deck
k this deck
43
The following data represent the filling weights based on samples of 14.5 ounce cans of whole peeled tomatoes. Ten samples of size 5 were taken. Use Excel to develop an x-bar chart.
Unlock Deck
Unlock for access to all 72 flashcards in this deck.
Unlock Deck
k this deck
44
Process control and acceptance sampling procedures are most closely related to
A)linear regression procedures
B)interval estimation procedures
C)hypothesis testing procedures
D)analysis of variance procedures
A)linear regression procedures
B)interval estimation procedures
C)hypothesis testing procedures
D)analysis of variance procedures
Unlock Deck
Unlock for access to all 72 flashcards in this deck.
Unlock Deck
k this deck
45
A production process is considered in control if 4% of the items produced are defective. Samples of size 100 are used for the inspection process.
a.Determine the standard error of the proportion.
b.Determine the upper and the lower control limits for the p chart.
a.Determine the standard error of the proportion.
b.Determine the upper and the lower control limits for the p chart.
Unlock Deck
Unlock for access to all 72 flashcards in this deck.
Unlock Deck
k this deck
46
In practice, it is common to use the sample _____ to estimate the process _________.
A)variances, range
B)means, variance
C)standard deviations, mean
D)ranges, standard deviation
A)variances, range
B)means, variance
C)standard deviations, mean
D)ranges, standard deviation
Unlock Deck
Unlock for access to all 72 flashcards in this deck.
Unlock Deck
k this deck
47
Brakes Shop, Inc., is a franchise that specializes in repairing brake systems of automobiles. The company purchases brake shoes from a national supplier. Currently, lots of 1,000 brake shoes are purchased, and each shoe is inspected before being installed on an automobile. The company has decided, instead of 100% inspection, to adopt an acceptance sampling plan.
a.Explain what is meant by the acceptance sampling plan.
b.If the company decides to adopt an acceptance sampling plan, what kinds of risks are there?
c.The quality control department of the company has decided to select a sample of 10 shoes and inspect them for defects. Furthermore, it has been decided that if the sample contains no defective parts, the entire lot will be accepted. If there are 50 defective shoes in a shipment, what is the probability that the entire lot will be accepted?
d.What is the probability of accepting the lot if there are 100 defective units in the lot?
Unlock Deck
Unlock for access to all 72 flashcards in this deck.
Unlock Deck
k this deck
48
The upper and lower control limits of a process are 66 and 54. Samples of size 16 are used for the inspection process. Determine the mean and the standard deviation for this process.
Unlock Deck
Unlock for access to all 72 flashcards in this deck.
Unlock Deck
k this deck
49
A soft drink filling machine is set up to fill bottles with 12 ounces of soft drink. The standard deviation s is known to be 0.4 ounces. The quality control department periodically selects samples of 16 bottles and measures their contents. Assume the distribution of filling volumes is normal.
a.Determine the upper and lower control limits and explain what they indicate.
b.The means of six samples were 11.8, 12.2, 11.9, 11.9, 12.1, and 11.8 ounces. Construct an x-bar chart and indicate whether or not the process is in control.
a.Determine the upper and lower control limits and explain what they indicate.
b.The means of six samples were 11.8, 12.2, 11.9, 11.9, 12.1, and 11.8 ounces. Construct an x-bar chart and indicate whether or not the process is in control.
Unlock Deck
Unlock for access to all 72 flashcards in this deck.
Unlock Deck
k this deck
50
The quality control department of a company has decided to select a sample of 20 items from each shipment of goods it receives and inspect them for defects. It has been decided that if the sample contains no defective parts, the entire lot will be accepted. Each shipment contains 1,000 items.
a.What is the probability of accepting a lot that contains 10% defective items?
b.What is the probability of accepting a lot that contains 5% defective items?
c.What is the probability of rejecting a lot that contains 15% defective items?
a.What is the probability of accepting a lot that contains 10% defective items?
b.What is the probability of accepting a lot that contains 5% defective items?
c.What is the probability of rejecting a lot that contains 15% defective items?
Unlock Deck
Unlock for access to all 72 flashcards in this deck.
Unlock Deck
k this deck
51
The following data represent the filling weights based on samples of 14.5 ounce cans of whole peeled tomatoes. Ten samples of size 5 were taken. Use Excel to develop an R chart.
Unlock Deck
Unlock for access to all 72 flashcards in this deck.
Unlock Deck
k this deck
52
We can examine the effect of the sampling plan on both types of risks by varying the assumed
A)percentage of defective items in the lot
B)number of defective items in the sample
C)probability of accepting the lot
D)number of units in the lot
A)percentage of defective items in the lot
B)number of defective items in the sample
C)probability of accepting the lot
D)number of units in the lot
Unlock Deck
Unlock for access to all 72 flashcards in this deck.
Unlock Deck
k this deck
53
If the value of c in a single-stage sampling plan is increased, with n remaining constant, the probability of accepting the lot
A)increases
B)decreases
C)is unchanged
D)might increase or decrease, depending on the lot percent defective
A)increases
B)decreases
C)is unchanged
D)might increase or decrease, depending on the lot percent defective
Unlock Deck
Unlock for access to all 72 flashcards in this deck.
Unlock Deck
k this deck
54
Heavy emphasis on statistical analysis and careful measurement are closely associated with
A)Total Quality
B)ISO 9000
C)Baldrige National Quality Program
D)Six Sigma
A)Total Quality
B)ISO 9000
C)Baldrige National Quality Program
D)Six Sigma
Unlock Deck
Unlock for access to all 72 flashcards in this deck.
Unlock Deck
k this deck
55
A production process is considered in control if 6% of the items produced are defective. Samples of size 300 are used for the inspection process.
a.Determine the standard error of the proportion.
b.Determine the upper and the lower control limits for the p chart.
a.Determine the standard error of the proportion.
b.Determine the upper and the lower control limits for the p chart.
Unlock Deck
Unlock for access to all 72 flashcards in this deck.
Unlock Deck
k this deck
56
Control charts based on data that can be measured on a continuous scale are called
A)normal control charts
B)variables control charts
C)attributes control charts
D)precision control charts
A)normal control charts
B)variables control charts
C)attributes control charts
D)precision control charts
Unlock Deck
Unlock for access to all 72 flashcards in this deck.
Unlock Deck
k this deck
57
The process mean and standard deviation can be estimated by using samples that are selected from the process when
A)it has only assignable-cause variation
B)its output is uniformly distributed
C)it is assumed to be operating in control
D)it is operating at peak capacity
A)it has only assignable-cause variation
B)its output is uniformly distributed
C)it is assumed to be operating in control
D)it is operating at peak capacity
Unlock Deck
Unlock for access to all 72 flashcards in this deck.
Unlock Deck
k this deck
58
The following data represent the filling weights based on samples of 350-gram containers. Ten samples of size 5 were taken. Use Excel to develop an R chart.
Unlock Deck
Unlock for access to all 72 flashcards in this deck.
Unlock Deck
k this deck
59
An acceptance sampling plan uses a sample of 18 with an acceptance criterion of zero. Determine the probability of accepting shipments that contain 5, 10, 15, 20, 25, 30, 35, 40, and 45% defective units.
Unlock Deck
Unlock for access to all 72 flashcards in this deck.
Unlock Deck
k this deck
60
The following data represent the filling weights based on samples of 350-gram containers. Ten samples of size 5 were taken. Use Excel to develop an x-bar chart.
Unlock Deck
Unlock for access to all 72 flashcards in this deck.
Unlock Deck
k this deck
61
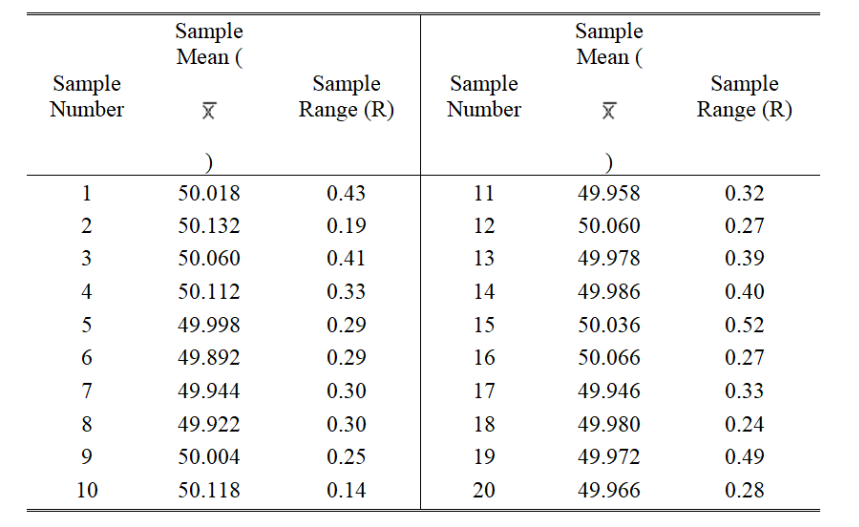
Harry Coates wants to construct and R charts at the bag-filling operation for Meow Chow cat food. He knows that when the filling operation is functioning correctly, bags of cat food should average 50.00 pounds and 5-bag samples should have an average range of .330 pounds.
Harry had twenty 5-bag samples taken at 2-hour intervals and the sample means and ranges are shown below. Determine the center lines and upper and lower control limits for the and R charts.
and R charts at the bag-filling operation for Meow Chow cat food. He knows that when the filling operation is functioning correctly, bags of cat food should average 50.00 pounds and 5-bag samples should have an average range of .330 pounds.Harry had twenty 5-bag samples taken at 2-hour intervals and the sample means and ranges are shown below. Determine the center lines and upper and lower control limits for the
and R charts. Unlock Deck
Unlock for access to all 72 flashcards in this deck.
Unlock Deck
k this deck
62
To inspect incoming shipments of components, a manufacturer is considering samples of sizes 12, 15, and 18. Use binomial probabilities to select a sampling plan that provides a producer's risk of = .12 when p0 is .04 and a consumer's risk of = .08 when p1 is .25.
Unlock Deck
Unlock for access to all 72 flashcards in this deck.
Unlock Deck
k this deck
63
Janie Hochevar, director of production at the center, has decided to record the number of defective labels in random daily samples on control charts. Janie estimates that 1.5 percent loose labels is typical when the labeling process is in control.
Twelve daily samples, each consisting of 200 pairs of jeans, were selected and examined. The number of defective labels found in each sample is shown below.
a. Determine the center line and the 3s control limits for the p chart.
b. Decide if the labeling operation is in control.
Twelve daily samples, each consisting of 200 pairs of jeans, were selected and examined. The number of defective labels found in each sample is shown below.
a. Determine the center line and the 3s control limits for the p chart.
b. Decide if the labeling operation is in control.
Unlock Deck
Unlock for access to all 72 flashcards in this deck.
Unlock Deck
k this deck
64
The weight of bags of cement filled by Granite Rock Company's packaging process is normally distributed with a mean of 50 pounds and a standard deviation of 1.5 pounds when the process is in control. What should the control limits be for a sample mean, , chart if 9 bags are sampled at a time?
, chart if 9 bags are sampled at a time? Unlock Deck
Unlock for access to all 72 flashcards in this deck.
Unlock Deck
k this deck
65
A process that is in control has a mean of = 56.5 and a standard deviation of = 3.4. What should the control limits be for a sample mean chart if samples of size 8 are taken?
Unlock Deck
Unlock for access to all 72 flashcards in this deck.
Unlock Deck
k this deck
66
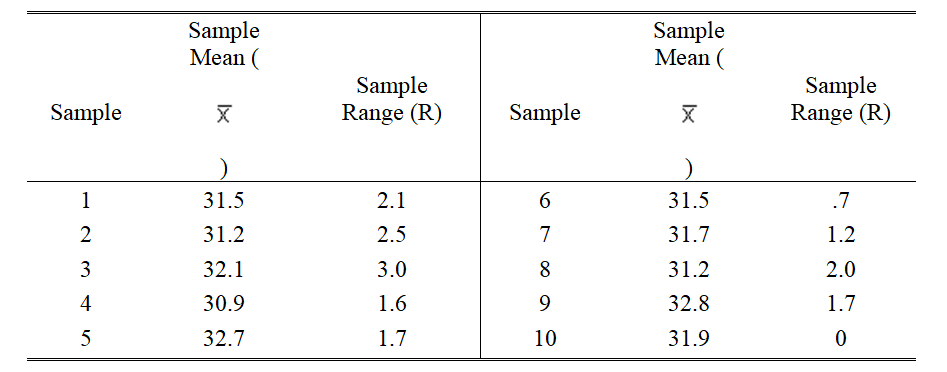
The No-Cal Bottling Company bottles soft drinks for sale to government commissaries. The bottles come in only one flavor (chocolate-lemon) and only one size (32 ounces). Joan Stickler, the quality control officer for the commissaries, wants to keep track of the fill weights of No-Cal and begins to draw daily samples of 100 bottles from the daily receipts. The first ten sample means and ranges are:
If sample ranges ordinarily average 2.5 ounces:
a. Compute 3s control limits for sample means.
b. Compute 3s control limits for sample ranges.
c. What would you conclude about the fill weights of NoCal?
If sample ranges ordinarily average 2.5 ounces: a. Compute 3s control limits for sample means.
b. Compute 3s control limits for sample ranges.
c. What would you conclude about the fill weights of NoCal?
Unlock Deck
Unlock for access to all 72 flashcards in this deck.
Unlock Deck
k this deck
67
An acceptance sampling plan with n = 20 and c = 1 has been designed with a producer's risk of .12.
a. Was the value of p0 equal to .02, .03, .04, or .05?
b. What is the consumer's risk associated with this plan if p1 is .08?
c. Assume the consumer's risk found in (b) is unacceptably high. Which modification of the sampling plan will result in the greater reduction of the consumer's risk, increasing n to 30 or decreasing c to 0?
Unlock Deck
Unlock for access to all 72 flashcards in this deck.
Unlock Deck
k this deck
68
Ledd Electronics has received a large shipment of power supply units for the desktop computers being assembled. The units are coming from a new supplier and Ledd is not sure what the actual defect rate will be for this component. Ledd is considering an acceptance sampling plan with n = 30 and c = 1.
a. Find the probability of accepting a lot when the defect rate is 2%, 4%, and 6%.
b. What happens to the producer's risk as the defect rate increases?
c. What happens to the consumer's risk as the defect rate increases?
a. Find the probability of accepting a lot when the defect rate is 2%, 4%, and 6%.
b. What happens to the producer's risk as the defect rate increases?
c. What happens to the consumer's risk as the defect rate increases?
Unlock Deck
Unlock for access to all 72 flashcards in this deck.
Unlock Deck
k this deck
69
The quality control department of a company has decided to select a sample of 10 items from the shipments received; and if the sample contains no defective parts, the entire shipment will be accepted.
a.If there are 40 defective items in a shipment, what is the probability that the entire lot will be accepted?
b.Use the binomial table and read the probability of accepting lots that contain 5, 10, 15, 20, 25, 30, 35, 40, 45, and 50% defective units.
a.If there are 40 defective items in a shipment, what is the probability that the entire lot will be accepted?
b.Use the binomial table and read the probability of accepting lots that contain 5, 10, 15, 20, 25, 30, 35, 40, 45, and 50% defective units.
Unlock Deck
Unlock for access to all 72 flashcards in this deck.
Unlock Deck
k this deck
70
A U.S. manufacturer of digital video recorders purchases a circuit board from a Taiwanese firm. The circuit boards are shipped in lots of 2000. The acceptance sampling procedure uses 12 randomly selected circuit boards. The acceptance number is 1. If p0 is .03 and p1 is .20, what are the producer's and consumer's risks for this plan?
Unlock Deck
Unlock for access to all 72 flashcards in this deck.
Unlock Deck
k this deck
71
Snipper, Inc. manufactures lawnmowers that require minor, final assembly by the customer. A sealed plastic bag containing the hardware (nuts, bolts, washers, and so on) needed for final assembly is included with each lawnmower shipped. During a week of normal, in-control operation, twenty samples of 200 bags of hardware were examined for content (hardware type and count) accuracy. A total of 104 bags of the 4000 examined failed to have the correct contents.
a. Compute the upper limit, center line, and lower limit for a p chart.
b. Compute the upper limit, center line, and lower limit for an np chart.
a. Compute the upper limit, center line, and lower limit for a p chart.
b. Compute the upper limit, center line, and lower limit for an np chart.
Unlock Deck
Unlock for access to all 72 flashcards in this deck.
Unlock Deck
k this deck
72
A process sampled 30 times with a sample of size nine resulted in = 12.7 and = 0.8. Compute the upper and lower control limits for the and charts for this process.
= 12.7 and = 0.8. Compute the upper and lower control limits for the and charts for this process. Unlock Deck
Unlock for access to all 72 flashcards in this deck.
Unlock Deck
k this deck
Unlock Deck
Unlock for access to all 72 flashcards in this deck.


