Ecology 5th Edition by Manuel Molles
Edition 5ISBN: 978-0070171688Ecology 5th Edition by Manuel Molles
Edition 5ISBN: 978-0070171688 Exercise 18
Why did the massive sampling efforts associated with the moth collections shown in figure 16.4 reveal only a portion of the lognormal distribution, while the studies of birds and plants produced the nearly complete lognormal distributions shown in figure 16.3? 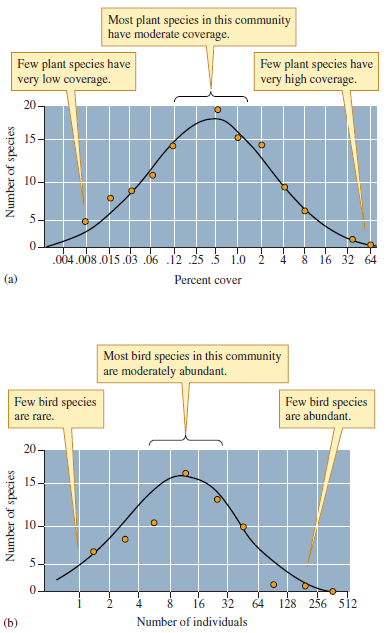
Figure 16.3 Lognormal distributions of ( a ) desert plants and
( b ) forest birds (data from Whittaker 1965, Preston 1962a).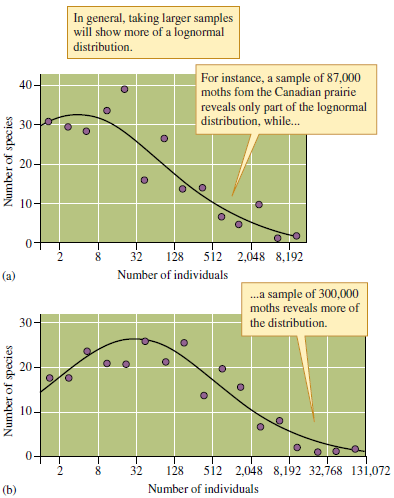
Figure 16.4 Sample size and the lognormal distribution (data from Preston 1948).
Figure 16.3 Lognormal distributions of ( a ) desert plants and
( b ) forest birds (data from Whittaker 1965, Preston 1962a).
Figure 16.4 Sample size and the lognormal distribution (data from Preston 1948).
Explanation Verified
The lognormal distribution can be plotte...
Ecology 5th Edition by Manuel Molles
Why don’t you like this exercise?
Other Minimum 8 character and maximum 255 character
Character 255


