Ecology 5th Edition by Manuel Molles
Edition 5ISBN: 978-0070171688Ecology 5th Edition by Manuel Molles
Edition 5ISBN: 978-0070171688 Exercise 3
The following data (corrected from Preston 1962a) give the area and number of bird species on islands in the West Indies: 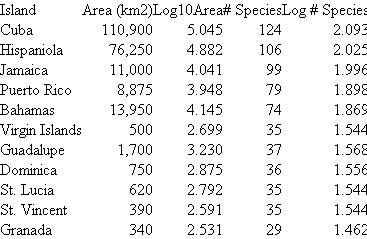 The numbers are expressed in two ways: as simple measurements and counts and as the logarithms of area and numbers of species. Use these data to plot your own species-area relationship. Plot area on the horizontal axis and number of species on the vertical axis. First plot the simple measurements of area and species number on one graph, and then plot the logarithms of area and species number on another graph. Which gives you the tightest relationship between area and species richness?
The numbers are expressed in two ways: as simple measurements and counts and as the logarithms of area and numbers of species. Use these data to plot your own species-area relationship. Plot area on the horizontal axis and number of species on the vertical axis. First plot the simple measurements of area and species number on one graph, and then plot the logarithms of area and species number on another graph. Which gives you the tightest relationship between area and species richness?Explanation Verified
Ecologists have shown that the number of...
Ecology 5th Edition by Manuel Molles
Why don’t you like this exercise?
Other Minimum 8 character and maximum 255 character
Character 255


