Becker's World of the Cell 9th Edition by Lewis Kleinsmith, Jeff Hardin, Gregory Paul Bertoni
Edition 9ISBN: 9780134295510Becker's World of the Cell 9th Edition by Lewis Kleinsmith, Jeff Hardin, Gregory Paul Bertoni
Edition 9ISBN: 9780134295510 Exercise 13
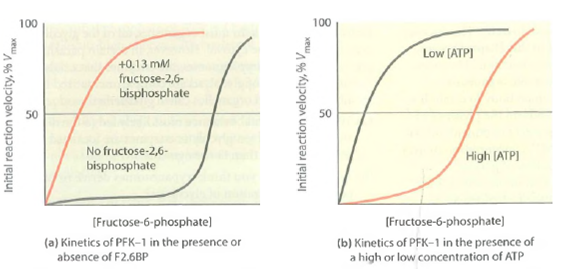
Regulation of Phosphofructokinase-1. Shown in Figure are plots of initial reaction velocity (expressed as % of Vmax)vs. fructose-6-phosphate concentration for liver phosphofructokinase (PFK-1)in the presence and absence of fructose-2,6-bisphosphate (F2.6BP)(Figure 9-14a)and in the presence of a low or high concentration of ATP (Figure b).
(a)Explain the effect of F2,6BP on enzyme activity as shown in Figure a.
(b)Explain the effect of the ATP concentration on the data shown in Figure b.
(c)What assumptions do you have to make about the concentration of ATP in Figure a and about the concentration of F2.6BP in Figure b Explain.
FIGURE Allosteric Regulation of Phosphofructokinase-1. Shown here are Michaelis-Menten plots of liver phosphofructokinase (PFK-1)activity, depicting (a)the dependence of initial reaction velocity on concentration of the substrate fructose-6-phosphate in the presence (red line)or absence (black line)of fructose- 2,6-bisphosphate and (b)the dependence of initial reaction velocity on fructose-6-phosphate concentration at high (red line)or low (black line)ATP concentrations. In both cases, initial reaction velocity is expressed as a percentage of Vmax, the maximum velocity.
Explanation Verified
(a)
It can be seen that with fructose-2,...
Becker's World of the Cell 9th Edition by Lewis Kleinsmith, Jeff Hardin, Gregory Paul Bertoni
Why don’t you like this exercise?
Other Minimum 8 character and maximum 255 character
Character 255


