
Microeconomics 20th Edition by Campbell McConnell, Stanley Brue,Sean Flynn
Edition 20ISBN: 978-0077660819Microeconomics 20th Edition by Campbell McConnell, Stanley Brue,Sean Flynn
Edition 20ISBN: 978-0077660819 Exercise 1
Briefly explain the use of graphs as a way to represent economic relationships. What is an inverse relationship How does it graph What is a direct relationship How does it graph
Explanation Verified
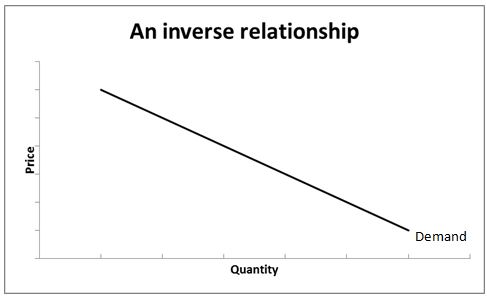
Graphs are very important in economics as it represents the behavior of one variable when another variable moves. For example, a very important relation that is seen in introductory economics is the relationship between price and quantity. If we are looking at consumers, we would expect that as the price of goods goes up, the quantity demanded of the good will go down. The relation that as one variable goes up, the other variable goes down is called an inverse relationship, and can be represented with a downward sloping line as shown in the graph below.
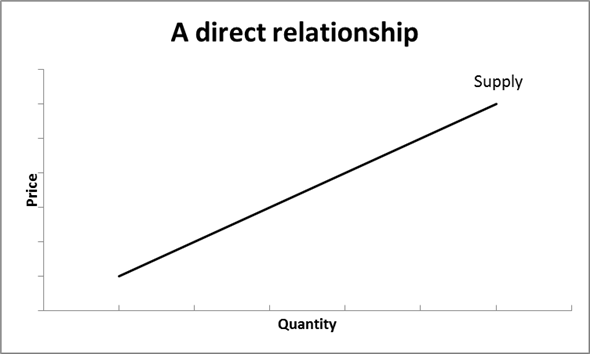
 A direct relationship between two variables can be defined in this way: if one variable goes up, the other variable also goes up. This is mostly seen in the supply of a good. If we are look at the producers of a good, we would expect that when the price is low, producers probably don't want to produce that much. However, when the price is high, producers can make more money and thus will want to sell more of that item. Thus, here, we will get a graph with an upward sloping line as shown below.
A direct relationship between two variables can be defined in this way: if one variable goes up, the other variable also goes up. This is mostly seen in the supply of a good. If we are look at the producers of a good, we would expect that when the price is low, producers probably don't want to produce that much. However, when the price is high, producers can make more money and thus will want to sell more of that item. Thus, here, we will get a graph with an upward sloping line as shown below.Microeconomics 20th Edition by Campbell McConnell, Stanley Brue,Sean Flynn
Why don’t you like this exercise?
Other Minimum 8 character and maximum 255 character
Character 255


