Cost Management 6th Edition by Edward Blocher,David Stout ,Paul Juras,Gary Cokins
Edition 6ISBN: 978-0078025532Cost Management 6th Edition by Edward Blocher,David Stout ,Paul Juras,Gary Cokins
Edition 6ISBN: 978-0078025532 Exercise 57
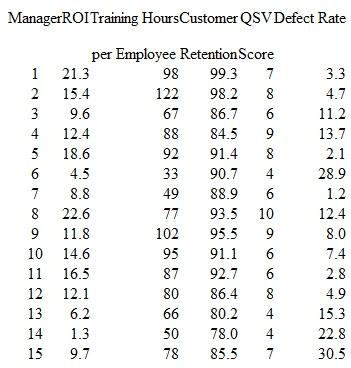
Performance Evaluation; Strategy Map; Review of Chapter 18; Correlation Analysis Maydew Manufacturing Inc. is a large manufacturer of lawn and garden equipment including mowers, edgers, tillers, related equipment, and accessories. The firm has been very successful in recent years, and sales have grown more than 10 percent in each of the last five years. The firm is organized into 15 investment centers based on product-line groups. Return on investment (ROI) and residual income (RI) calculations have been made for each of the last four years and used in management compensation for the last two years. Recently Maydew's top management has contracted with MM PC, a large consulting firm to review the performance-measurement process at the firm. One of MM PC's key recommendations has been to consider the implementation of the balanced scorecard (BSC) both for performance measurement and for strategic management. As a step in this direction, MM PC has asked Maydew for some data on ROI and other measures being considered for the BSC to analyze the relationships among these data. It is hoped that the analysis will help MM PC develop a strategy map for the firm. The following data show the most recent year's ROI for each investment center and the average for the last three years for training hours per employee in the center, customer retention rate in the unit (customers are primarily large department store chains and other distributors of lawn and garden equipment), the QSV score, and the defect rate (per thousand products). The QSV score is a measure of the Quality-Service-Value of the investment center made by an analysis of a variety of operating data including the results of on-site inspection of each unit by key operating executives and other measures of operating performance (the highest score is 10, and the lowest is 0).
 Required
1. Using the concept of the strategy map, consider how the nonfinancial factors (training hours, customer retention, QSV, and defect rate) affect ROI. Which of these variables has the greatest influence on ROI Use regression and correlation analysis to address this requirement.
2. Explain which two managers you would rate as the best overall and which you would rate as the worst overall, and give reasons why.
Required 1. Using the concept of the strategy map, consider how the nonfinancial factors (training hours, customer retention, QSV, and defect rate) affect ROI. Which of these variables has the greatest influence on ROI Use regression and correlation analysis to address this requirement.
2. Explain which two managers you would rate as the best overall and which you would rate as the worst overall, and give reasons why.
Explanation Verified
The objective of this problem is to have...
Cost Management 6th Edition by Edward Blocher,David Stout ,Paul Juras,Gary Cokins
Why don’t you like this exercise?
Other Minimum 8 character and maximum 255 character
Character 255


