
Macroeconomics 12th Edition by Michael Parkin
Edition 12ISBN: 978-0133872279Macroeconomics 12th Edition by Michael Parkin
Edition 12ISBN: 978-0133872279 Exercise 1
Explain how we "read" the three graphs in Fig. 1 and 2.
FIGURE 1 Making a Graph
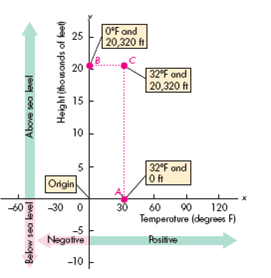
Graphs have axes that measure quantities as distances. Here, the horizontal axis ( x -axis) measures temperature, and the vertical axis ( y -axis) measures height. Point A represents a fishing boat at sea level (0 on the y -axis) on a day when the temperature is 32°F. Point B represents a climber at the top of Mt. McKinley, 20,320 feet above sea level at a temperature of 0°F. Point C represents a climber at the top of Mt. McKinley, 20,320 feet above sea level at a temperature of 32°F.
FIGURE 2 Two Graphs of Economic Data
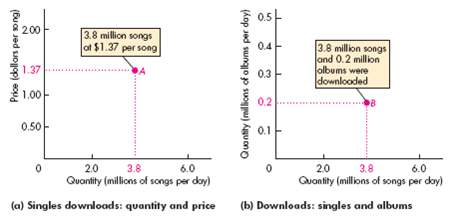
The graph in part (a) tells us that in 2010, 3.8 million songs per day were downloaded at an average price of $1.37 per song.
The graph in part (b) tells us that in 2010, 3.8 million songs per day and 0.2 million albums per day were downloaded.
FIGURE 1 Making a Graph
Graphs have axes that measure quantities as distances. Here, the horizontal axis ( x -axis) measures temperature, and the vertical axis ( y -axis) measures height. Point A represents a fishing boat at sea level (0 on the y -axis) on a day when the temperature is 32°F. Point B represents a climber at the top of Mt. McKinley, 20,320 feet above sea level at a temperature of 0°F. Point C represents a climber at the top of Mt. McKinley, 20,320 feet above sea level at a temperature of 32°F.
FIGURE 2 Two Graphs of Economic Data
The graph in part (a) tells us that in 2010, 3.8 million songs per day were downloaded at an average price of $1.37 per song.
The graph in part (b) tells us that in 2010, 3.8 million songs per day and 0.2 million albums per day were downloaded.
Explanation Verified
We read the first graph as follows:
First of all, we should know about the two axes on a graph, the horizontal is the x -axis and vertical is the y -axis. At the x -axis this graph measured the temperature in Fahrenheit, and at the y -axis, the height is in thousands of feet. The two axes meet at the point of origin 'o'. If we look at the x-axis, at point A, the height is zero feet, and the temperature is recorded as 32 Fahrenheit. Similarly, on the y -axis, at point B, the temperature is 0 degrees, and height is 20,320 feet. At point C, an x -coordinate, and a y -coordinate are drawn, and the temperature is recorded as 32 degrees, and height is 20,320 feet.
We read the second graph as follows:
In figure, (a), we find that the price, which is expressed in cents per song, are kept on the y -axis, and the quantity, which is in millions of songs per day, is on the x -axis. The point A, with an x - coordinate stands at 8.3, and a y -coordinate where the price per song stands at 99 cents per song has been plotted in the graph. Thus, point A in the graph informs that 8.3 million songs in a day were downloaded at a price of 99 cents per song.
In figure, (b), we find that the values on the x-axis is similar to figure (a), i.e. showing the quantity of millions of songs downloaded per day. On the y-axis, quantity of albums downloaded in millions per day is indicated. The point B, with x coordinate equal to.4 million and y-coordinate at 8.3 million songs per day has been indicated.
Thus, all in all, second figure indicates that in January 2010, about 8.3 million songs, and.4 million albums were downloaded from the iTunes at a price of 99 cents per song.
Macroeconomics 12th Edition by Michael Parkin
Why don’t you like this exercise?
Other Minimum 8 character and maximum 255 character
Character 255


