Macroeconomics + Economy 2009 Update 18th Edition by Campbell McConnell, Sean Masaki Flynn,Stanley Brue
Edition 18ISBN: 9780077354237Macroeconomics + Economy 2009 Update 18th Edition by Campbell McConnell, Sean Masaki Flynn,Stanley Brue
Edition 18ISBN: 9780077354237 Exercise 20
Complete the accompanying table.
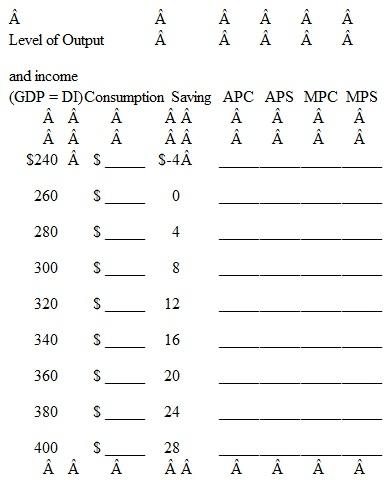
Data for completing the table (top to bottom). Consumption: $244; $260; $276; $292; $308; $324; $340; $356; $372. APC: 1.02; 1.00;.99;.97;.96;.95;.94;.94;.93. APS: -.02;.00;.01;.03;.04;.05;.06;.06;.07. MPC:.80 throughout. MPS:.20 throughout.
a. Show the consumption and saving schedules graphically.
b. Find the break even level of income. Explain how is it possible for households to dissave at very low income levels.
c. If the proportion of total income consumed (APC) decreases and the proportion saved (APS) increases as income rises, explain both verbally and graphically how the MPC and MPS can be constant at various levels of income.
Explanation Verified
(a)
For the given table, the values of c...
Macroeconomics + Economy 2009 Update 18th Edition by Campbell McConnell, Sean Masaki Flynn,Stanley Brue
Why don’t you like this exercise?
Other Minimum 8 character and maximum 255 character
Character 255


