Environmental Science: A Global ConcernEnvironmental Science: A Global Concern 11th Edition by William Cunningham, Mary Ann Cunningham
Edition 11ISBN: 978-0697806451Environmental Science: A Global ConcernEnvironmental Science: A Global Concern 11th Edition by William Cunningham, Mary Ann Cunningham
Edition 11ISBN: 978-0697806451 Exercise 1
How do you extract data from a bar graph Look again at the bar graph in figure. Using the same procedure described for a line plot, draw a horizontal line from the top of any bar straight to the Y-axis. Read the value for the frequency of that category on the Y-axis.
FIGURE
Urban air quality.
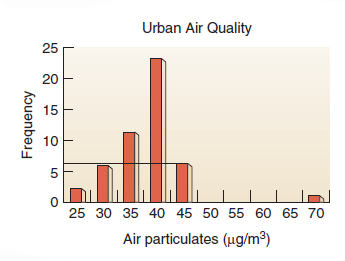
• Why don't you need to draw a vertical line with this type of graph
• How many cities have 30 ug/m3
• Why aren't there any bars between 50 and 65 ug/m3
• Why are there so many more cities at 40 ug/m3
• Why is one city at 70 ug/m3
• How many more cities have 40 ug/m3 than 30 ug/m3
FIGURE
Urban air quality.
• Why don't you need to draw a vertical line with this type of graph
• How many cities have 30 ug/m3
• Why aren't there any bars between 50 and 65 ug/m3
• Why are there so many more cities at 40 ug/m3
• Why is one city at 70 ug/m3
• How many more cities have 40 ug/m3 than 30 ug/m3
Explanation Verified
Frequency- in specific data, the number ...
Environmental Science: A Global ConcernEnvironmental Science: A Global Concern 11th Edition by William Cunningham, Mary Ann Cunningham
Why don’t you like this exercise?
Other Minimum 8 character and maximum 255 character
Character 255


