
Cost Management: A Strategic Emphasis 7th Edition by Edward Blocher,David Stout ,Paul Juras,Gary Cokins
Edition 7ISBN: 978-0077733773Cost Management: A Strategic Emphasis 7th Edition by Edward Blocher,David Stout ,Paul Juras,Gary Cokins
Edition 7ISBN: 978-0077733773 Exercise 7
Contribution Income Statements Using Excel; Sensitivity Analysis; Goal Seek
Required
1. Using the data from 2016 in Exhibit 9.1, create an Excel spreadsheet to provide a sensitivity analysis of the effect on operating profit of potential changes in demand for HFI, Inc. Use Exhibits 9.2 and 9.6 as a guide. Assume that two-thirds of fixed costs are manufacturing-related; the remaining one-third are selling-related. The variable manufacturing cost per unit is $30, while the variable selling cost per unit is $5. ( Hint: Calculate the DOL for 2016 at a sales volume of 2,400 units. How does this figure help interpret your sensitivity analysis results )
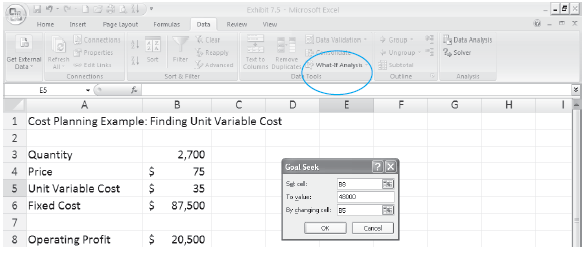
2. Use the Goal Seek tool within Excel to determine the sales price per unit that would allow HFI to earn an operating profit of $100,000, assuming that all the other cost information is the same as in Exhibit 9.1. Use Exhibit 9.5 as a guide.
EXHIBIT 9.1 Data for Household Furnishings, Inc. (HFI): TV Table
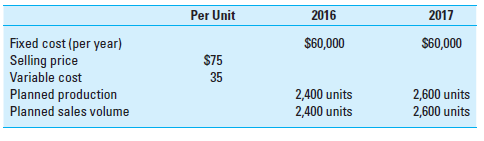
EXHIBIT 9.2 Contribution Income Statements for HFI's Proposed TV Table
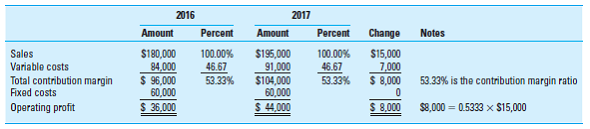
EXHIBIT 9.6 What-If Sensitivity Analysis for HFI, Inc., Using a Data Table
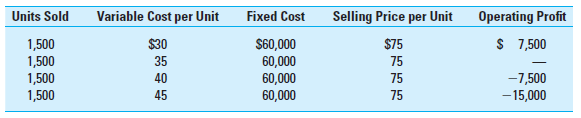
EXHIBIT 9.5 Using Goal Seek in CVP Analysis
Required
1. Using the data from 2016 in Exhibit 9.1, create an Excel spreadsheet to provide a sensitivity analysis of the effect on operating profit of potential changes in demand for HFI, Inc. Use Exhibits 9.2 and 9.6 as a guide. Assume that two-thirds of fixed costs are manufacturing-related; the remaining one-third are selling-related. The variable manufacturing cost per unit is $30, while the variable selling cost per unit is $5. ( Hint: Calculate the DOL for 2016 at a sales volume of 2,400 units. How does this figure help interpret your sensitivity analysis results )
2. Use the Goal Seek tool within Excel to determine the sales price per unit that would allow HFI to earn an operating profit of $100,000, assuming that all the other cost information is the same as in Exhibit 9.1. Use Exhibit 9.5 as a guide.
EXHIBIT 9.1 Data for Household Furnishings, Inc. (HFI): TV Table
EXHIBIT 9.2 Contribution Income Statements for HFI's Proposed TV Table
EXHIBIT 9.6 What-If Sensitivity Analysis for HFI, Inc., Using a Data Table
EXHIBIT 9.5 Using Goal Seek in CVP Analysis
Explanation

This question doesn’t have an expert verified answer yet, let Examlex AI Copilot help.
Cost Management: A Strategic Emphasis 7th Edition by Edward Blocher,David Stout ,Paul Juras,Gary Cokins
Why don’t you like this exercise?
Other Minimum 8 character and maximum 255 character
Character 255


