A Visual Approach to SPSS for Windows 2nd Edition by Leonard Stern
Edition 2ISBN: 978-0205706051A Visual Approach to SPSS for Windows 2nd Edition by Leonard Stern
Edition 2ISBN: 978-0205706051 Exercise 4
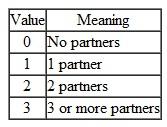
Randomly selected participants in the U.S. were surveyed between 1988 and 1998 by the National Opinion Research Center and asked to evaluate how happy they were on a scale of 1-3 where 1=very happy, 2=pretty happy, and 3=not too happy. Another question requested participants to report how many sex partners they had during the past year. In the file HappyPartner2.sav provided on the publisher's website for this text, http://www.pearsonhighered.com/stern2e, the variable Happy contains responses to the question about happiness and the variable Partner2 codes responses about number of sex partners using the values 0-3 where the numbers have the following meaning:
 The data file also contains the variable gender (1 = male and 2 = female).
Although the variable Happy does not measure happiness on an interval or ratio scale, treat it as though it did. Perform a two-way ANOVA to determine whether mean happiness as measured by the variable Happy is significantly related to the number of sex partners a person reports ( Partner2 ) and the respondent's gender as measured by the variable gender. Based on your output, answer the following questions:
1. What effects are significant
2. Is it appropriate to conclude that males are happier than females or must that conclusion be made conditional on the number of partners a person has
The data file also contains the variable gender (1 = male and 2 = female).Although the variable Happy does not measure happiness on an interval or ratio scale, treat it as though it did. Perform a two-way ANOVA to determine whether mean happiness as measured by the variable Happy is significantly related to the number of sex partners a person reports ( Partner2 ) and the respondent's gender as measured by the variable gender. Based on your output, answer the following questions:
1. What effects are significant
2. Is it appropriate to conclude that males are happier than females or must that conclusion be made conditional on the number of partners a person has
Explanation Verified
1.
A two-way ANOVA test for the data fil...
A Visual Approach to SPSS for Windows 2nd Edition by Leonard Stern
Why don’t you like this exercise?
Other Minimum 8 character and maximum 255 character
Character 255


