
An Introduction to Management Science 13th Edition by David Anderson,Dennis Sweeney ,Thomas Williams ,Jeffrey Camm, Kipp Martin
Edition 13ISBN: 978-1439043271An Introduction to Management Science 13th Edition by David Anderson,Dennis Sweeney ,Thomas Williams ,Jeffrey Camm, Kipp Martin
Edition 13ISBN: 978-1439043271 Exercise 31
The Nielsen ratings (percentage of U.S. households that tuned in) for the Masters golf tournament from 1997 through 2008 follow ( Golf Magazine , January 2009); 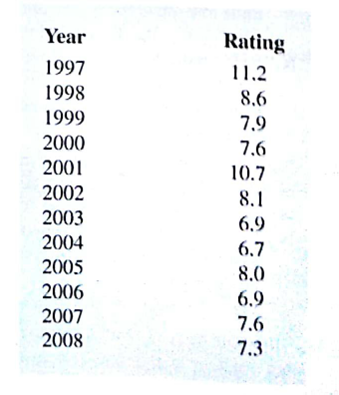
The rating 11.2 in 1997 indicates that 11.2% of U.S. households tuned in to watch Tiger Woods win his first major golf tournament and become the first African-American to win the Masters. Tiger Woods also won the Masters in 2001 and 2005.
a. Construct a time series plot. What type of pattern exists in the data? Discuss some of the factors that may have resulted in the pattern exhibited in the time series plot for this time series.
b. Given the pattern of the time series plot developed in part(a), do you think the forecasting methods discussed in this section are appropriate to develop forecasts for this time series? Explain.
c. Would you recommend using only the Nielsen ratings for 2002-2008 to forecast the rating for 2009, or should the entire time series from 1997-2008 be used? Explain.
Explanation Verified
An Introduction to Management Science 13th Edition by David Anderson,Dennis Sweeney ,Thomas Williams ,Jeffrey Camm, Kipp Martin
Why don’t you like this exercise?
Other Minimum 8 character and maximum 255 character
Character 255


