
Managing for Quality and Performance Excellence 10th Edition by James Evans ,William Lindsay
Edition 10ISBN: 978-1305662544Managing for Quality and Performance Excellence 10th Edition by James Evans ,William Lindsay
Edition 10ISBN: 978-1305662544 Exercise 82
A distributor of electrical automation and power transmission products implemented a total quality program. One manager was eager to collect data about the organization's receiving process because of a decrease in the organization's on-time deliveries. The manager suspected that the data entry person in the purchasing department was not entering data in the computer in a timely fashion; consequently, packages could not be properly processed for subsequent shipping to the customer.
TABLE 8.6 Packing Slip Error Counts
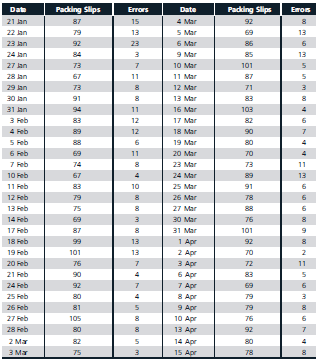
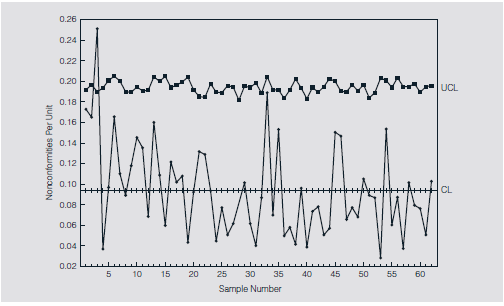
FIGURE 8.51 u -Chart Packing Slip Errors
A preliminary analysis indicated that the manager's notion was inaccurate. In fact, the manager was able to see that the data entry person was doing an excellent job. The analysis showed that handling packages that were destined for a branch operation in the same fashion as other packages created significant delays. A simple process change of placing a branch designation letter in front of the purchase order number told the receiving clerk to place those packages on a separate skid for delivery to the branch.
However, this analysis revealed a variety of other problems. Generally, anywhere from 65 to 110 packing slips were processed each day. These were found to contain many errors in addition to the wrong destination designation that contributed to the delays. Errors included
• Wrong purchase order
• Wrong quantity
• Purchase order not on the system
• Original order not on the system
• Parts do not match
• Purchase order was entered incorrectly
• Double shipment
• Wrong parts
• No purchase order
Many packing slips contained multiple errors. Table 8.6 shows the number of packing slips and total errors identified. A u-chart was constructed for each day to track the number of packing slip errors-defects-found. A u-chart was used because the sample size varied each day. Thus, the statistic monitored was the number of errors per packing slip. Figure 8.51 shows the u-chart that was constructed for this period. (This change in the branch designation took place on January 24, resulting in significant improvement, as shown on the chart.)
Although the chart shows that the process is in control (since the branch designation change), the average error rate of more than 9 percent still was not considered acceptable. After consolidating the types of errors into five categories, a Pareto analysis was performed. This analysis showed the following:
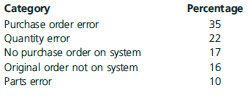
The analysis is illustrated in Figure 8.52.
FIGURE 8.52 Pareto Analysis of Packing Slip Errors
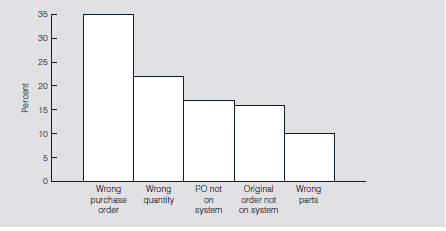
The first two categories accounted for more than half of the errors. The remedy for these problems was to develop a training module on proper purchasing methods to ensure that vendors knew the correct information needed on the purchase orders. The third category-no purchase order on the computer system-caused receiving personnel to stage the orders until an investigation could find the necessary information. Because of this problem, the company realized it needed to revamp the original order-writing process. Specifically, both the order-writing and purchase order activities needed to be improved.
An analysis of the control chart shows that the average error rate has gradually improved. To a large extent, this improvement was due to the recognition of the problems and enhanced communication among the constituents. While the full training program had not been implemented at the time this case was written, the company believed that a significant reduction in the error rate would result once the training was completed.
What information might a separate chart for each error category provide? Would you recommend spending the time and effort to make these additional computations?
TABLE 8.6 Packing Slip Error Counts
FIGURE 8.51 u -Chart Packing Slip Errors
A preliminary analysis indicated that the manager's notion was inaccurate. In fact, the manager was able to see that the data entry person was doing an excellent job. The analysis showed that handling packages that were destined for a branch operation in the same fashion as other packages created significant delays. A simple process change of placing a branch designation letter in front of the purchase order number told the receiving clerk to place those packages on a separate skid for delivery to the branch.
However, this analysis revealed a variety of other problems. Generally, anywhere from 65 to 110 packing slips were processed each day. These were found to contain many errors in addition to the wrong destination designation that contributed to the delays. Errors included
• Wrong purchase order
• Wrong quantity
• Purchase order not on the system
• Original order not on the system
• Parts do not match
• Purchase order was entered incorrectly
• Double shipment
• Wrong parts
• No purchase order
Many packing slips contained multiple errors. Table 8.6 shows the number of packing slips and total errors identified. A u-chart was constructed for each day to track the number of packing slip errors-defects-found. A u-chart was used because the sample size varied each day. Thus, the statistic monitored was the number of errors per packing slip. Figure 8.51 shows the u-chart that was constructed for this period. (This change in the branch designation took place on January 24, resulting in significant improvement, as shown on the chart.)
Although the chart shows that the process is in control (since the branch designation change), the average error rate of more than 9 percent still was not considered acceptable. After consolidating the types of errors into five categories, a Pareto analysis was performed. This analysis showed the following:
The analysis is illustrated in Figure 8.52.
FIGURE 8.52 Pareto Analysis of Packing Slip Errors
The first two categories accounted for more than half of the errors. The remedy for these problems was to develop a training module on proper purchasing methods to ensure that vendors knew the correct information needed on the purchase orders. The third category-no purchase order on the computer system-caused receiving personnel to stage the orders until an investigation could find the necessary information. Because of this problem, the company realized it needed to revamp the original order-writing process. Specifically, both the order-writing and purchase order activities needed to be improved.
An analysis of the control chart shows that the average error rate has gradually improved. To a large extent, this improvement was due to the recognition of the problems and enhanced communication among the constituents. While the full training program had not been implemented at the time this case was written, the company believed that a significant reduction in the error rate would result once the training was completed.
What information might a separate chart for each error category provide? Would you recommend spending the time and effort to make these additional computations?
Explanation Verified
Facts:
A Manager works in a Company whi...
Managing for Quality and Performance Excellence 10th Edition by James Evans ,William Lindsay
Why don’t you like this exercise?
Other Minimum 8 character and maximum 255 character
Character 255


