
Ecology 6th Edition by Manuel Molles
Edition 6ISBN: 978-0073532493Ecology 6th Edition by Manuel Molles
Edition 6ISBN: 978-0073532493 Exercise 11
One of the most common and important steps in the processing of data is the production of summary statistics. First, what is a statistic A statistic is a number that is used by scientists to estimate a measurable characteristic of an entire population. Population characteristics of interest to an ecologist might include features such as average mass, growth rate, or, as in this chapter, air temperature. In order to determine the exact average value of such population characteristics, the ecologist would have to measure every individual in the population. Clearly, the opportunity to measure or test all the individuals in a population for any characteristic is extremely rare. For instance, an ecologist studying reproductive rate in a population of birds would be unlikely to locate and study all the nests in the population. As a consequence, ecologists generally estimate reproductive rates for birds, or other characteristics of any population, using samples drawn randomly from the population. An ecologist working with a population of rare plants, for example, might locate 11 seedlings and calculate the average height of these 11 individual plants. This average calculated from the sample of 11 seedlings would be the sample mean. The sample mean is a statistical estimate of the true population mean.
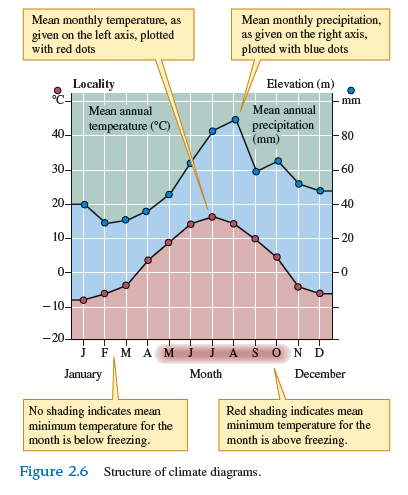
The sample mean is one of the most common and useful summary statistics. It is a statistic that we use extensively in this chapter as we discuss average temperature or average precipitation for biomes around the world (see fig 2.6 , p. 16). How is the sample mean calculated Consider the following sample of seedling height.
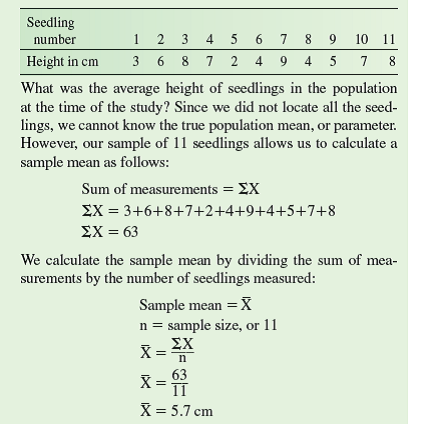
Again, 5.7 cm, the sample mean, is the ecologist's estimate of the true mean height of seedlings in the entire population at the time of the study
If you measured the heights of 100 seedlings randomly drawn from the hypothetical population, instead of the 11 measured in the example, would the sample mean be likely to be exactly 5.7 cm
The sample mean is one of the most common and useful summary statistics. It is a statistic that we use extensively in this chapter as we discuss average temperature or average precipitation for biomes around the world (see fig 2.6 , p. 16). How is the sample mean calculated Consider the following sample of seedling height.
Again, 5.7 cm, the sample mean, is the ecologist's estimate of the true mean height of seedlings in the entire population at the time of the study
If you measured the heights of 100 seedlings randomly drawn from the hypothetical population, instead of the 11 measured in the example, would the sample mean be likely to be exactly 5.7 cm
Explanation

This question doesn’t have an expert verified answer yet, let Examlex AI Copilot help.
Ecology 6th Edition by Manuel Molles
Why don’t you like this exercise?
Other Minimum 8 character and maximum 255 character
Character 255


