Macroeconomics 5th Edition by Olivier Blanchard
Edition 5ISBN: 978-0132159869Macroeconomics 5th Edition by Olivier Blanchard
Edition 5ISBN: 978-0132159869 Exercise 1
Suppose that the production function is given by 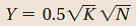
a. Derive the steady-state levels of output per worker and capital per worker in terms of the saving rate, s, and the depreciation rate,
b. Derive the equation for steady-state output per worker and steady-state consumption per worker in terms of s and
c. Suppose that
With your favorite spreadsheet software, compute steady-state output per worker and steady-state consumption per worker for s = 0; s = 0.1; s = 0.2; ………; s = 1. Explain the intuition behind your results.
d. Use your favorite spreadsheet software to graph the steady-state level of output per worker and the steady-state level of consumption per worker as a function of the saving rate (i.e., measure the saving rate on the horizontal axis of your graph and the corresponding values of output per worker and consumption per worker on the vertical axis).
e. Does the graph show that there is a value of s that maximizes output per worker Does the graph show that there is a value of s that maximizes consumption per worker If so, what is this value
Explanation Verified
Macroeconomics 5th Edition by Olivier Blanchard
Why don’t you like this exercise?
Other Minimum 8 character and maximum 255 character
Character 255


