
Macroeconomics 5th Edition by Olivier Blanchard
Edition 5ISBN: 978-0132159869Macroeconomics 5th Edition by Olivier Blanchard
Edition 5ISBN: 978-0132159869 Exercise 7
Growth accounting
The appendix to this chapter shows how data on output, capital, and labor can be used to construct estimates of the rate of growth of technological progress. We modify that approach in this problem to examine the growth of capital per worker.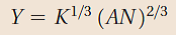
The function gives a good description of production in rich countries. Following the same steps as in the appendix, you can show that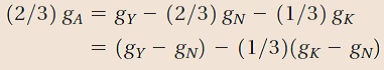
Where g y denotes the growth rate of Y.
a. What does the quantity g Y - g N represent What does the quantity g K - g N represent
b. Rearrange the preceding equation to solve for the growth rate of capital per worker.
c. Look at Table 12-2 in the chapter. Using your answer to part (b), substitute in the average annual growth rate of output per worker and the average annual rate of technological progress for the United States for the period 1985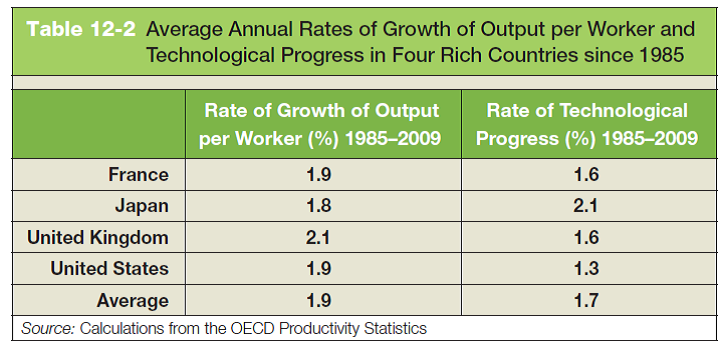
to 2009 to obtain a crude measure of the average annual growth of capital per worker. (Strictly speaking, we should construct these measures individually for every year, but we limit ourselves to readily available data in this problem.) Do the same for the other countries listed in Table 12-2. How does the average growth of capital per worker compare across the countries in Table 12-2 Do the results make sense to you Explain.
Explanation Verified
(a) The quantity ![]() equals the growth rate...
equals the growth rate...
Macroeconomics 5th Edition by Olivier Blanchard
Why don’t you like this exercise?
Other Minimum 8 character and maximum 255 character
Character 255


