Environmental Science 15th Edition by Scott Spoolman,Tyler Miller
Edition 15ISBN: 978-1305090446Environmental Science 15th Edition by Scott Spoolman,Tyler Miller
Edition 15ISBN: 978-1305090446 Exercise 1
The following table is a sample of a very large body of data reported by J. P. Collins, M. L. Crump, and T. E. Lovejoy III in their book Extinction in Our Times-Global Amphibian Decline. It compares various areas of the world in terms of the number of amphibian species found and the number of amphibian species that were endemic, or unique to each area. Scientists like to know these percentages because endemic species tend to be more vulnerable to extinction than do non-endemic species. Study the table below and then answer the following questions.
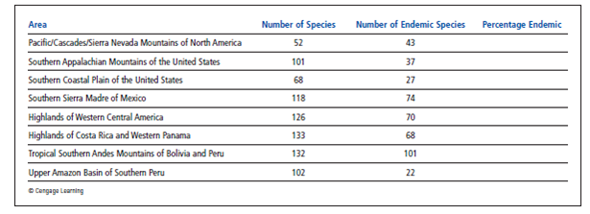
Which two areas have the lowest numbers of endemic species? Which two areas have the lowest percentages of endemic species?
Which two areas have the lowest numbers of endemic species? Which two areas have the lowest percentages of endemic species?
Explanation Verified
The data is shown below:
![]() As per the gi...
As per the gi...
Environmental Science 15th Edition by Scott Spoolman,Tyler Miller
Why don’t you like this exercise?
Other Minimum 8 character and maximum 255 character
Character 255


