Environmental Science 15th Edition by Scott Spoolman,Tyler Miller
Edition 15ISBN: 978-1305090446Environmental Science 15th Edition by Scott Spoolman,Tyler Miller
Edition 15ISBN: 978-1305090446 Exercise 7
The chart below shows selected population data for two different countries, A and B. Study the chart and answer the questions that follow.
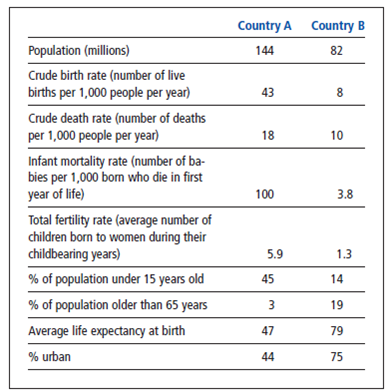
Explain how the percentages of people under age 15 in each country could affect its per capita and total ecological footprints.
Explain how the percentages of people under age 15 in each country could affect its per capita and total ecological footprints.
Explanation Verified
The age structure has major role in econ...
Environmental Science 15th Edition by Scott Spoolman,Tyler Miller
Why don’t you like this exercise?
Other Minimum 8 character and maximum 255 character
Character 255


