
Campbell Biology 11th Edition by Lisa Urry,Michael Cain,Steven Wasserman,Peter Minorsky,Jane Reece
Edition 11ISBN: 978-0134093413Campbell Biology 11th Edition by Lisa Urry,Michael Cain,Steven Wasserman,Peter Minorsky,Jane Reece
Edition 11ISBN: 978-0134093413 Exercise 13
Does Thyroid Hormone Level Affect Oxygen Consumption in Cells Some animals, such as mammals and birds, maintain a relatively constant body temperature, above that of their environment, using heat produced as a by-product of metabolism. When the core temperature of these animals drops below an internal set point, their cells are triggered to reduce the efficiency of ATP produced by the electron transport chains in mitochondria. At lower efficiency, extra fuel must be consumed to produce the same number of ATPs, generating additional heat. Because this response is moderated by the endocrine system, researchers hypothesized that thyroid hormone might trigger this cellular response. In this exercise, you will use a bar graph to visualize data from an experiment that compared the metabolic rate (by measuring oxygen consumption) in mitochondria of cells from animals with different levels of thyroid hormone.
How the Experiment Was Done Liver cells were isolated from sibling rats that had low, normal, or elevated thyroid hormone levels. The oxygen consumption rate due to activity of the mitochondrial electron transport chains of each type of cell was measured under controlled conditions.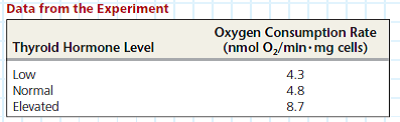
Interpret the Data
To visualize any differences in oxygen consumption between cell types, it will be useful to graph the data in a bar graph. First, you'll set up the axes. (a) What is the independent variable (intentionally varied by the researchers), which goes on the x -axis List the categories along the x -axis; because they are discrete rather than continuous, you can list them in any order. (b) What is the dependent variable (measured by the researchers), which goes on the y -axis (c) What units (abbreviated) should go on the y -axis Label the y -axis, including the units specified in the data table. Determine the range of values of the data that will need to go on the y -axis. What is the largest value Draw evenly spaced tick marks and label them, starting with 0 at the bottom.
Explanation Verified
Thyroid hormones are those hormones that...
Campbell Biology 11th Edition by Lisa Urry,Michael Cain,Steven Wasserman,Peter Minorsky,Jane Reece
Why don’t you like this exercise?
Other Minimum 8 character and maximum 255 character
Character 255


