Exam 19: Economic Inequality
Exam 1: What Is Economics479 Questions
Exam 2: The Economic Problem439 Questions
Exam 3: Demand and Supply515 Questions
Exam 4: Elasticity533 Questions
Exam 5: Efficiency and Equity449 Questions
Exam 6: Government Actions in Markets410 Questions
Exam 7: Global Markets in Action200 Questions
Exam 8: Utility and Demand364 Questions
Exam 9: Possibilities, Preferences, and Choices464 Questions
Exam 10: Organizing Production385 Questions
Exam 11: Output and Costs494 Questions
Exam 12: Perfect Competition487 Questions
Exam 13: Monopoly606 Questions
Exam 14: Monopolistic Competition320 Questions
Exam 15: Oligopoly280 Questions
Exam 16: Public Choices and Public Goods356 Questions
Exam 17: Externalities and the Environment284 Questions
Exam 18: Markets for Factors of Production382 Questions
Exam 19: Economic Inequality354 Questions
Exam 20: Uncertainty and Information233 Questions
Exam 21: Extension A: Review11 Questions
Exam 22: Extension B: Review25 Questions
Exam 23: Extension C: Review14 Questions
Exam 24: Extension D: Review38 Questions
Exam 25: Extension E: Review11 Questions
Exam 26: Extension F: Review18 Questions
Select questions type
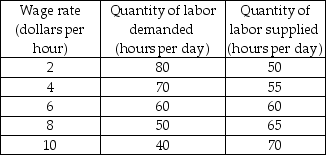 -The table above shows the demand for labor and supply of labor schedules for low-skilled labor. If the labor market is competitive, what is the wage rate of low-skilled labor and what is the quantity of low-skilled labor employed?
Free
(Multiple Choice)
4.9/5  (33)
(33)
Correct Answer: Verified
A
If Bianca earns 5 percent on her wealth and that income amounts to $40,000, what is Bianca's wealth?
Free
(Short Answer)
4.8/5 (42)
Correct Answer:Verified
Bianca's wealth is $800,000.
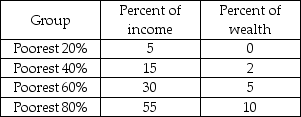 -The above table shows the distribution of wealth and income in Miseria. The Lorenz curve for wealth would
Free
(Multiple Choice)
4.8/5 (32)
Correct Answer:Verified
B
From left to right, the horizontal axis of the Lorenz curve ranks households from
(Multiple Choice)
4.7/5 (34)
Using the government as a means of redistribution generates equity at the cost of efficiency, in part because
(Multiple Choice)
4.7/5 (41)
With respect to redistribution, one reason "The Big Tradeoff" exists is because
(Multiple Choice)
4.7/5 (39)
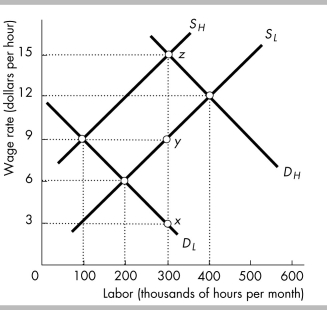 -The above figure shows the supply and demand curves for high-skilled and low-skilled labor. High-skilled workers earn a wage rate of
(Multiple Choice)
4.7/5 (30)
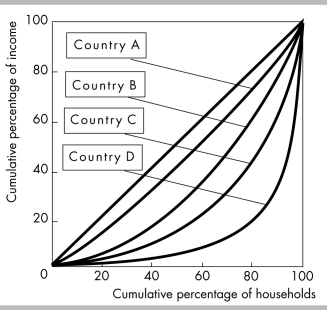 -The above figure shows the Lorenz curves for four different countries. Which of the following statements CANNOT be made on the basis of the graph?
(Multiple Choice)
4.8/5 (39)
If a Lorenz curve for income moves rightward and becomes more bowed out over time, then
(Multiple Choice)
4.9/5 (26)
How has income inequality changed in recent years? What factors account for the changes?
(Essay)
4.8/5 (45)
The demand curve for high-skilled workers lies to the right of the demand curve for low-skilled workers because of the costs associated with obtaining skills.
(True/False)
4.9/5 (39)
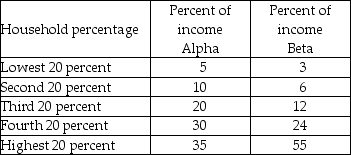 -The above table shows the distribution of income in two imaginary countries, Alpha and Beta.
a) What does the table tell you about the second 20 percent group in each country?
b) Calculate the cumulative percentage for both countries.
c) Interpret the cumulative percentage for the third 20 percent group in both countries.
-The above table shows the distribution of income in two imaginary countries, Alpha and Beta.
a) What does the table tell you about the second 20 percent group in each country?
b) Calculate the cumulative percentage for both countries.
c) Interpret the cumulative percentage for the third 20 percent group in both countries.
(Essay)
4.8/5 (42)
What effect does the age of a household have when estimating the degree of inequality in income among households?
(Essay)
4.9/5 (26)
Which household characteristic has the largest effect on household income distribution?
(Multiple Choice)
4.8/5 (30)
On a Lorenz curve graph, the area between the line of equality and the Lorenz curve is 2,000, and the entire area beneath the line of equality is 5,000. What does the Gini ratio equal?
(Essay)
4.8/5 (28)
The Lithuanian tax rate for all citizens' income is 24 percent. If the Lithuanian government was concerned about income inequality, they should change the tax system from a system that is currently ________ to a system that is ________.
(Multiple Choice)
4.9/5 (34)
Of the following, which is the most accurate indicator of the degree of inequality?
(Multiple Choice)
4.9/5 (35)
Filters
- Essay(0)
- Multiple Choice(0)
- Short Answer(0)
- True False(0)
- Matching(0)