Exam 14: The Demand and Supply of Resources
Exam 1: The Five Foundations of Economics101 Questions
Exam 2: Model Building and Gains From Trade147 Questions
Exam 3: The Market at Work: Supply and Demand132 Questions
Exam 4: Elasticity132 Questions
Exam 5: Price Controls134 Questions
Exam 6: The Efficiency of Markets and the Costs of Taxation152 Questions
Exam 7: Market Inefficiencies: Externalities and Public Goods144 Questions
Exam 8: Business Costs and Production149 Questions
Exam 9: Firms in a Competitive Market135 Questions
Exam 10: Understanding Monopoly137 Questions
Exam 11: Price Discrimination138 Questions
Exam 12: Monopolistic Competition and Advertising133 Questions
Exam 13: Oligopoly and Strategic Behavior151 Questions
Exam 14: The Demand and Supply of Resources115 Questions
Exam 15: Income,inequality,and Poverty128 Questions
Exam 16: Consumer Choice119 Questions
Exam 17: Behavioral Economics and Risk Taking95 Questions
Exam 18: Health Insurance and Health Care123 Questions
Select questions type
No matter how high his wage rises,Johann will always work more.His labor supply curve is:
(Multiple Choice)
4.8/5  (36)
(36)
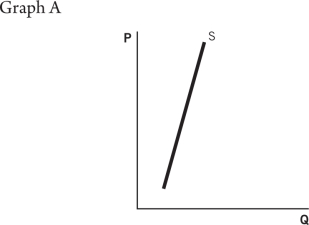
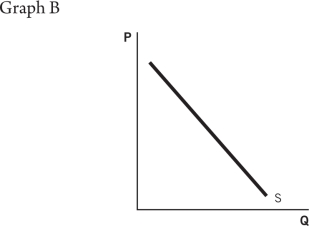
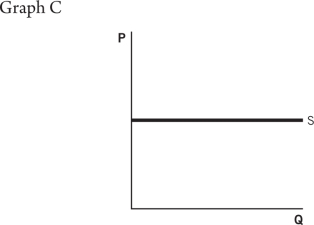
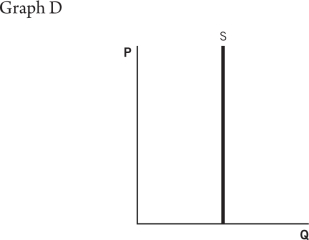
Refer to the accompanying graphs to answer the questions that follow.
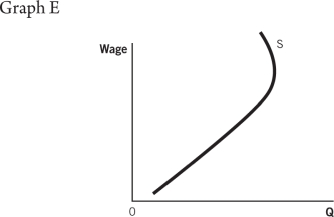 -The minimum wage is increased to $15.This higher wage might __________ labor force participation,shifting the labor supply curve to the __________.
(Multiple Choice)
4.9/5 (36)
A company that produces simple textiles outsources its operations to Indonesia.Wages for Indonesian workers will __________ and their employment will __________.
(Multiple Choice)
4.8/5 (28)
In theory,some people might lose in the short run from outsourcing,but in the long run,all should benefit.Which option demonstrates that this theory might not be true?
(Multiple Choice)
4.8/5 (32)
Which of the following situations does not represent derived demand?
(Multiple Choice)
4.8/5 (36)
Donna owns a temp agency.She sees demand for her workers increase because firms prefer a more contingent workforce.The value of the marginal product of labor of her temps:
(Multiple Choice)
4.9/5 (37)
Use the following information to answer the questions that follow.
Nicky L,owner of NLD Incorporated,knows that the marginal product of labor (MPL)for his workers can be defined as follows:
MPL = 32 - L
The total output a given level of workers can produce is found as:
Q = 32L - L2
He also knows that the price of his output is $3.His profits can be found as:
Profit = P
 Q - W
Q - W
 L
-What is the value of additional output produced by the twelfth worker?
L
-What is the value of additional output produced by the twelfth worker?
(Multiple Choice)
5.0/5 (39)
Refer to the accompanying graphs to answer the questions that follow.
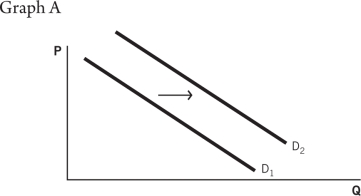
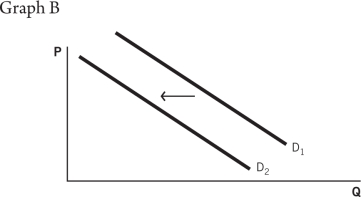
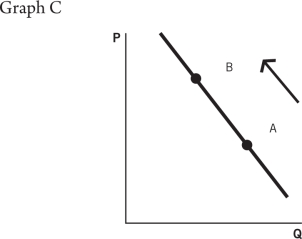
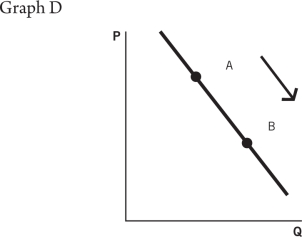
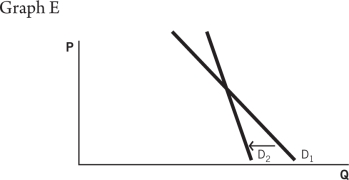 -Choose the graph that represents the following situation: A documentary on bottled water demonstrates the high impact this product has on the environment.In response,consumers drastically reduce their consumption of this product.
(Multiple Choice)
4.8/5 (37)
Companies can rent a manufacturing robot named RoboMan for $2,500 a month and must pay workers $20 an hour.The value of the marginal product of Roboman is $5,000,and the value of the marginal product of labor is $20.Companies should hire __________ RoboMen and __________ workers.
(Multiple Choice)
4.8/5 (36)
The accompanying graph depicts Mighty Max's labor demand for his duffle-bag business.The labor demand curve shown is calculated based on a duffel-bag price of $10.If the price increases to $20 per bag,what happens to the labor demand curve? 
(Multiple Choice)
4.9/5 (38)
Use the accompanying graph,which depicts Mighty Max's labor demand for his duffle-bag business,to answer the questions that follow.
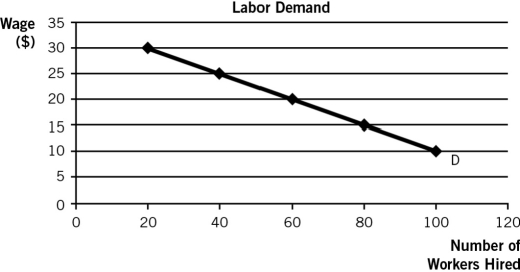 -If 80 workers are hired,you know that the wage rate must be:
(Multiple Choice)
4.8/5 (35)
Which company has the ability to outsource its operations and have its good or service produced in another country?
(Multiple Choice)
4.8/5 (37)
If the price of output is $5,the value of the marginal product of labor of the third worker is:
(Multiple Choice)
5.0/5 (40)
Refer to the accompanying graphs to answer the questions that follow.
-Immigration is when:
(Multiple Choice)
4.7/5 (39)
More job opportunities open up in the South,prompting labor supply curves in northern states to __________ and in southern states to __________.
(Multiple Choice)
4.8/5 (36)
Refer to the accompanying graphs to answer the questions that follow.
-Choose the graph that represents the following situation: Out of fear of losing their jobs in a depressed economic climate,workers increase their rate of production.
(Multiple Choice)
4.8/5 (24)
Which of the following describes the marginal product of labor?
(Multiple Choice)
4.8/5 (38)
Filters
- Essay(0)
- Multiple Choice(0)
- Short Answer(0)
- True False(0)
- Matching(0)