Exam 27: Policy Effects and Cost Shocks in the Asad Model
Exam 1: The Scope and Method of Economics238 Questions
Exam 2: The Economic Problem: Scarcity and Choice220 Questions
Exam 3: Demand, Supply, and Market Equilibrium298 Questions
Exam 4: Demand and Supply Applications173 Questions
Exam 5: Elasticity189 Questions
Exam 6: Household Behavior and Consumer Choice273 Questions
Exam 7: The Production Process: the Behavior of Profit-Maximizing Firms273 Questions
Exam 8: Short-Run Costs and Output Decisions387 Questions
Exam 9: Long-Run Costs and Output Decisions362 Questions
Exam 10: Input Demand: The Labor and Land Markets198 Questions
Exam 11: Input Demand: The Capital Market and the Investment Decision230 Questions
Exam 12: General Equilibrium and the Efficiency of Perfect Competition202 Questions
Exam 13: Monopoly and Antitrust Policy396 Questions
Exam 14: Oligopoly217 Questions
Exam 15: Monopolistic Competition235 Questions
Exam 16: Externalities, Public Goods, and Common Resources275 Questions
Exam 17: Uncertainty and Asymmetric Information132 Questions
Exam 18: Income Distribution and Poverty197 Questions
Exam 19: Public Finance: The Economics of Taxation281 Questions
Exam 20: Introduction to Macroeconomics241 Questions
Exam 21: Measuring National Output and National Income292 Questions
Exam 22: Unemployment, Inflation, and Long-Run Growth297 Questions
Exam 23: Aggregate Expenditure and Equilibrium Output355 Questions
Exam 24: The Government and Fiscal Policy360 Questions
Exam 25: Money, the Federal Reserve, and the Interest Rate357 Questions
Exam 26: The Determination of Aggregate Output, the Price Level, and the Interest Rate243 Questions
Exam 27: Policy Effects and Cost Shocks in the Asad Model200 Questions
Exam 28: The Labor Market in the Macroeconomy287 Questions
Exam 29: Financial Crises, Stabilization, and Deficits260 Questions
Exam 30: Household and Firm Behavior in the Macroeconomy: a Further Look364 Questions
Exam 31: Long-Run Growth196 Questions
Exam 32: Alternative Views in Macroeconomics294 Questions
Exam 33: International Trade, Comparative Advantage, and Protectionism289 Questions
Exam 34: Open-Economy Macroeconomics: the Balance of Payments and Exchange Rates308 Questions
Exam 35: Economic Growth in Developing Economies133 Questions
Exam 36: Critical Thinking About Research105 Questions
Select questions type
Refer to the information provided in Figure 27.4 below to answer the question(s) that follow. 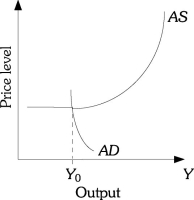 Figure 27.4
-Refer to Figure 27.4. If the economy is currently at the intersection of AS and AD, a decrease in AS with no change in AD will cause
Figure 27.4
-Refer to Figure 27.4. If the economy is currently at the intersection of AS and AD, a decrease in AS with no change in AD will cause
(Multiple Choice)
4.9/5  (31)
(31)
In a binding situation, there is ________ crowding out of planned investment when net taxes decrease.
(Multiple Choice)
5.0/5 (27)
Other things equal, cost-push inflation results in output ________ and the price level ________.
(Multiple Choice)
4.8/5 (42)
Since 1970, the Fed generally ________ the interest rate when inflation was ________.
(Multiple Choice)
4.8/5 (34)
A sudden increase in aggregate demand causes a ________ inflation and ________ output.
(Multiple Choice)
4.9/5 (43)
Refer to the information provided in Figure 27.2 below to answer the question(s) that follow. 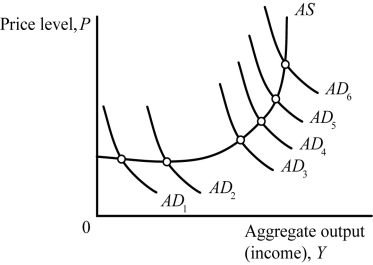 Figure 27.2
-Refer to Figure 27.2. Planned investment would experience the greatest amount of crowding out when the aggregate demand curve shifts from
Figure 27.2
-Refer to Figure 27.2. Planned investment would experience the greatest amount of crowding out when the aggregate demand curve shifts from
(Multiple Choice)
4.8/5 (45)
When aggregate supply is vertical, economic policies concerning output are
(Multiple Choice)
4.9/5 (33)
A rightward shift in the aggregate demand curve generates a ________ inflation and ________ output.
(Multiple Choice)
4.8/5 (43)
If the aggregate supply curve is vertical in the long-run, then neither monetary nor fiscal policy will affect aggregate output in the long-run.
(True/False)
4.7/5 (31)
Refer to the information provided in Figure 27.3 below to answer the question(s) that follow. 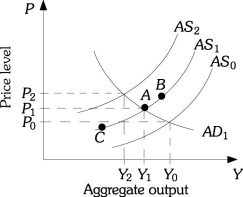 Figure 27.3
-Refer to Figure 27.3. Assume the economy is at Point A. Lower oil prices shift the aggregate supply curve to AS0. If the government decides to counter the effects of lower oil prices by decreasing net taxes, then the price level will be ________ than P0 and output will be ________ than Y0.
Figure 27.3
-Refer to Figure 27.3. Assume the economy is at Point A. Lower oil prices shift the aggregate supply curve to AS0. If the government decides to counter the effects of lower oil prices by decreasing net taxes, then the price level will be ________ than P0 and output will be ________ than Y0.
(Multiple Choice)
4.7/5 (39)
If the Fed has a strong preference for stable output relative to prices, the ________ curve is relatively ________.
(Multiple Choice)
4.7/5 (32)
Refer to the information provided in Figure 27.1 below to answer the question(s) that follow. 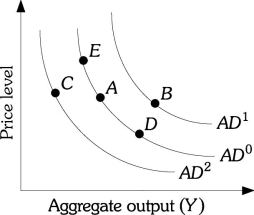 Figure 27.1
-Refer to Figure 27.1. Suppose the economy is at Point A. A(n) ________ can cause a movement to Point B.
Figure 27.1
-Refer to Figure 27.1. Suppose the economy is at Point A. A(n) ________ can cause a movement to Point B.
(Multiple Choice)
4.9/5 (38)
If wages adjust fully to price increases in the long run, the full effect of fiscal policy is on
(Multiple Choice)
4.8/5 (37)
Refer to the information provided in Figure 27.1 below to answer the question(s) that follow. Figure 27.1
-Refer to Figure 27.1. Suppose the economy is at Point A, an increase in the price level can cause a movement to Point
(Multiple Choice)
4.7/5 (38)
If wages quickly adjust to price changes, the aggregate supply curve quickly becomes vertical.
(True/False)
4.9/5 (43)
A decrease in the Z factors shifts the aggregate demand curve to the left.
(True/False)
4.8/5 (43)
If the Fed has a strong preference for stable prices relative to output, it responds to a price ________ with a ________ decrease in the interest rate.
(Multiple Choice)
4.9/5 (31)
Filters
- Essay(0)
- Multiple Choice(0)
- Short Answer(0)
- True False(0)
- Matching(0)