Exam 26: The Determination of Aggregate Output, the Price Level, and the Interest Rate
Exam 1: The Scope and Method of Economics238 Questions
Exam 2: The Economic Problem: Scarcity and Choice220 Questions
Exam 3: Demand, Supply, and Market Equilibrium298 Questions
Exam 4: Demand and Supply Applications173 Questions
Exam 5: Elasticity189 Questions
Exam 6: Household Behavior and Consumer Choice273 Questions
Exam 7: The Production Process: the Behavior of Profit-Maximizing Firms273 Questions
Exam 8: Short-Run Costs and Output Decisions387 Questions
Exam 9: Long-Run Costs and Output Decisions362 Questions
Exam 10: Input Demand: The Labor and Land Markets198 Questions
Exam 11: Input Demand: The Capital Market and the Investment Decision230 Questions
Exam 12: General Equilibrium and the Efficiency of Perfect Competition202 Questions
Exam 13: Monopoly and Antitrust Policy396 Questions
Exam 14: Oligopoly217 Questions
Exam 15: Monopolistic Competition235 Questions
Exam 16: Externalities, Public Goods, and Common Resources275 Questions
Exam 17: Uncertainty and Asymmetric Information132 Questions
Exam 18: Income Distribution and Poverty197 Questions
Exam 19: Public Finance: The Economics of Taxation281 Questions
Exam 20: Introduction to Macroeconomics241 Questions
Exam 21: Measuring National Output and National Income292 Questions
Exam 22: Unemployment, Inflation, and Long-Run Growth297 Questions
Exam 23: Aggregate Expenditure and Equilibrium Output355 Questions
Exam 24: The Government and Fiscal Policy360 Questions
Exam 25: Money, the Federal Reserve, and the Interest Rate357 Questions
Exam 26: The Determination of Aggregate Output, the Price Level, and the Interest Rate243 Questions
Exam 27: Policy Effects and Cost Shocks in the Asad Model200 Questions
Exam 28: The Labor Market in the Macroeconomy287 Questions
Exam 29: Financial Crises, Stabilization, and Deficits260 Questions
Exam 30: Household and Firm Behavior in the Macroeconomy: a Further Look364 Questions
Exam 31: Long-Run Growth196 Questions
Exam 32: Alternative Views in Macroeconomics294 Questions
Exam 33: International Trade, Comparative Advantage, and Protectionism289 Questions
Exam 34: Open-Economy Macroeconomics: the Balance of Payments and Exchange Rates308 Questions
Exam 35: Economic Growth in Developing Economies133 Questions
Exam 36: Critical Thinking About Research105 Questions
Select questions type
Refer to the information provided in Figure 26.3 below to answer the question(s) that follow.  Figure 26.3
-Refer to Figure 26.3. Following the recession of 2008-2009, many firms in the United States eventually began investing in new capital. This increase in investment in new capital would cause
Figure 26.3
-Refer to Figure 26.3. Following the recession of 2008-2009, many firms in the United States eventually began investing in new capital. This increase in investment in new capital would cause
(Multiple Choice)
4.8/5  (33)
(33)
Other things equal, a decrease in the Z factors ________ the equilibrium interest rate and ________ equilibrium output.
(Multiple Choice)
5.0/5 (33)
Refer to the information provided in Figure 26.4 below to answer the question(s) that follow.  Figure 26.4
-Refer to Figure 26.4. Suppose the economy is at Point A, a decrease in the price level moves the economy to Point
Figure 26.4
-Refer to Figure 26.4. Suppose the economy is at Point A, a decrease in the price level moves the economy to Point
(Multiple Choice)
4.9/5 (38)
An increase in the price level shifts the IS curve to the left.
(True/False)
4.8/5 (38)
Refer to the information provided in Figure 26.6 below to answer the question(s) that follow. 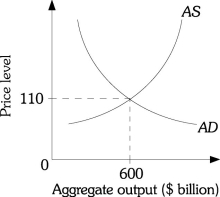 Figure 26.6
-Refer to Figure 26.6. Suppose the equilibrium output is initially $600 billion. A decrease in the Z factors ________ equilibrium output and ________ the price level.
Figure 26.6
-Refer to Figure 26.6. Suppose the equilibrium output is initially $600 billion. A decrease in the Z factors ________ equilibrium output and ________ the price level.
(Multiple Choice)
4.8/5 (38)
Refer to the information provided in Figure 26.2 below to answer the question(s) that follow.  Figure 26.2
-Refer to Figure 26.2. Between the output levels of $300 billion and $600 billion, the relationship between the price level and output is
Figure 26.2
-Refer to Figure 26.2. Between the output levels of $300 billion and $600 billion, the relationship between the price level and output is
(Multiple Choice)
4.9/5 (32)
When the interest rate is low, planned investment is ________ so output is ________.
(Multiple Choice)
5.0/5 (39)
If the price level falls, the aggregate supply decreases as a result of the aggregate demand curve shifting left.
(True/False)
4.9/5 (48)
When the aggregate supply curve is ________ the price of factors of production is fixed, with little or no upward pressure on price.
(Multiple Choice)
4.9/5 (38)
Refer to the information provided in Figure 26.6 below to answer the question(s) that follow. Figure 26.6
-Refer to Figure 26.6. Suppose the equilibrium output is initially $600 billion. An oil embargo would probably
(Multiple Choice)
4.9/5 (32)
A decrease in the "Z" factors shifts the aggregate demand curve to the left.
(True/False)
4.9/5 (31)
Refer to the information provided in Figure 26.5 below to answer the question(s) that follow. 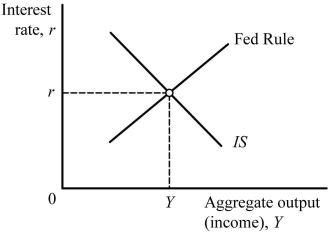 Figure 26.5
-Refer to Figure 26.5. An increase in the price level shifts the ________ to the ________.
Figure 26.5
-Refer to Figure 26.5. An increase in the price level shifts the ________ to the ________.
(Multiple Choice)
4.8/5 (35)
Refer to the information provided in Figure 26.8 below to answer the question(s) that follow. 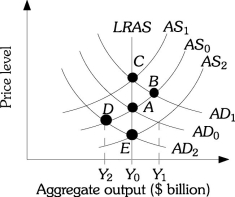 Figure 26.8
-Refer to Figure 26.8. If the economy is at Point A currently producing Y0 and the Z factors decrease, the economy will move to Point ________ in the short run and to Point ________ in the long run.
Figure 26.8
-Refer to Figure 26.8. If the economy is at Point A currently producing Y0 and the Z factors decrease, the economy will move to Point ________ in the short run and to Point ________ in the long run.
(Multiple Choice)
4.9/5 (40)
If ________ equilibrium output ________, the price level decreases.
(Multiple Choice)
4.9/5 (36)
The real wealth effect explains why the aggregate supply curve is horizontal in the long run.
(True/False)
4.8/5 (32)
Refer to the information provided in Figure 26.3 below to answer the question(s) that follow. Figure 26.3
-Refer to Figure 26.3. A decrease in aggregate supply is represented by
(Multiple Choice)
4.8/5 (29)
A decrease in the price of inputs shifts the AS curve to the left.
(True/False)
4.9/5 (36)
Filters
- Essay(0)
- Multiple Choice(0)
- Short Answer(0)
- True False(0)
- Matching(0)