Exam 9: Aggregate Demand Appendix: the Keynesian Cross
Exam 1: Economics: the Core Issues Appendix: Using Graphs125 Questions
Exam 2: The Us Economy: a Global View149 Questions
Exam 3: Supply and Demand137 Questions
Exam 4: The Role of Government128 Questions
Exam 5: National Income Accounting152 Questions
Exam 6: Unemployment111 Questions
Exam 7: Inflation106 Questions
Exam 8: The Business Cycle112 Questions
Exam 9: Aggregate Demand Appendix: the Keynesian Cross118 Questions
Exam 10: Self-Adjustment or Instability127 Questions
Exam 11: Fiscal Policy133 Questions
Exam 12: Deficits and Debt126 Questions
Exam 13: Money and Banks118 Questions
Exam 14: The Federal Reserve System111 Questions
Exam 15: Monetary Policy121 Questions
Exam 16: Supply-Side Policy: Short-Run Options119 Questions
Exam 17: Growth and Productivity: Long-Run Possibilities123 Questions
Exam 18: Theory Versus Reality125 Questions
Exam 19: Consumer Choice Appendix: Indifference Curves117 Questions
Exam 20: Elasticity120 Questions
Exam 21: The Costs of Production127 Questions
Exam 22: The Competitive Firm122 Questions
Exam 23: Competitive Markets120 Questions
Exam 24: Monopoly128 Questions
Exam 25: Oligopoly125 Questions
Exam 26: Monopolistic Competition132 Questions
Exam 27: Natural Monopolies: Deregulation122 Questions
Exam 28: Environmental Protection130 Questions
Exam 29: The Farm Problem117 Questions
Exam 30: The Labor Market117 Questions
Exam 31: Labor Unions123 Questions
Exam 32: Financial Markets121 Questions
Exam 33: Taxes: Equity Versus Efficiency117 Questions
Exam 34: Transfer Payments: Welfare and Social Security138 Questions
Exam 35: International Trade152 Questions
Exam 36: International Finance137 Questions
Exam 37: Global Poverty Glossary Index Reference Tables150 Questions
Select questions type
The line described by the consumption function C = a + bYD will change its slope when
(Multiple Choice)
4.9/5  (38)
(38)
Use the following figure to answer the questions : Figure9.3:
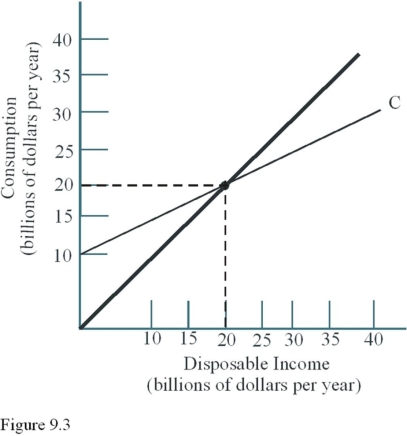 -According to Figure 9.3,which of the following is true?
(Multiple Choice)
4.9/5 (27)
Use the following table to answer the questions : Table9.2:
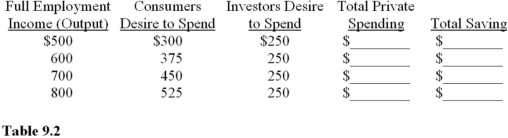 -Complete Table 9.2.(Data are expressed in billions of dollars. ) Given the information in Table 9.2,saving is equal to $200 billion at an output level of
(Multiple Choice)
4.8/5 (42)
If consumption is $340 and saving is $20,then disposable income
(Multiple Choice)
4.9/5 (39)
The consumption function will shift because of a change in current disposable income.
(True/False)
4.9/5 (37)
Which of the following will cause a decrease in U.S.gross exports?
(Multiple Choice)
4.8/5 (41)
The four components of aggregate spending are consumption,saving,imports,and taxes.
(True/False)
4.8/5 (46)
Use the following figure to answer the questions : Figure9.6:
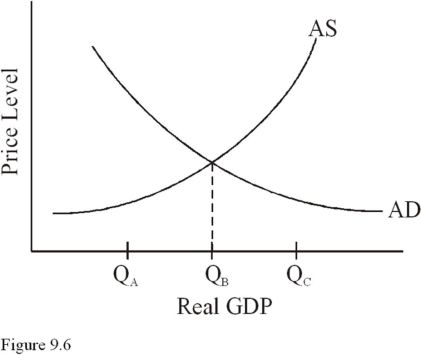 -In Figure 9.6,if full employment occurs at QA, then aggregate demand is
(Multiple Choice)
4.8/5 (35)
Which of the following will cause the aggregate demand curve to shift to the left?
(Multiple Choice)
4.8/5 (36)
Gross exports depend on the behavior of foreign businesses and consumers.
(True/False)
4.8/5 (34)
Use the following figure to answer the questions : Figure9.9
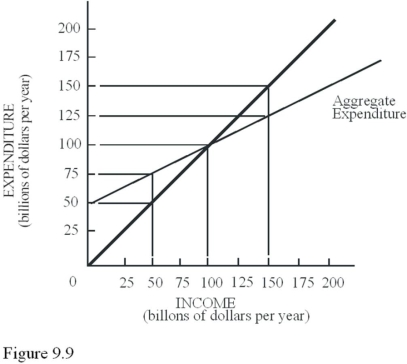 -If the economy depicted in Figure 9.9 produced at a full-employment output level of $50 billion instead of the equilibrium output level,inventory levels would
(Multiple Choice)
4.7/5 (34)
Which of the following is not a component of aggregate demand?
(Multiple Choice)
4.7/5 (38)
Given that C = $500 + 0.8YD,if the level of disposable income is $1,000,the level of saving is
(Multiple Choice)
4.9/5 (40)
State and local purchases of goods and services account for approximately _______ percent of total government purchases.
(Multiple Choice)
4.8/5 (45)
Use the following figure to answer the questions : Figure9.9
- If the economy depicted in Figure 9.9 produced at the full-employment output level of $150 billion instead of the equilibrium output level,inventory levels would
(Multiple Choice)
4.8/5 (39)
Use the following figure to answer the questions : Figure9.8
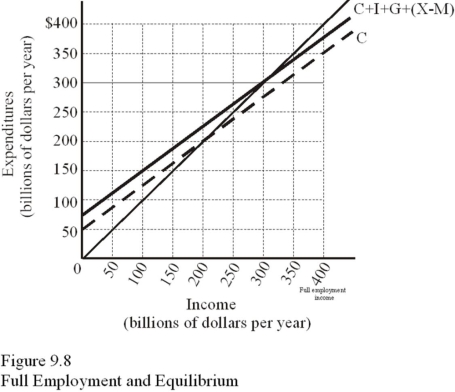 - In response to changing inventories in Figure 9.8,if the economy produces at full employment of $400 billion,firms will attempt to
(Multiple Choice)
4.8/5 (44)
The combination of price level and real output that is compatible with both aggregate demand and aggregate supply is the definition of
(Multiple Choice)
4.9/5 (40)
Use the following figure to answer the questions : Figure9.1:
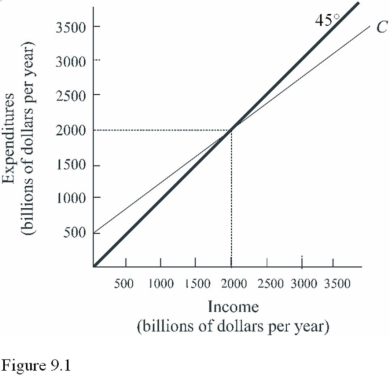 -Using Figure 9.1,the amount of autonomous consumption is
(Multiple Choice)
4.9/5 (40)
Which of the following causes a movement along the investment demand curve?
(Multiple Choice)
4.8/5 (35)
Filters
- Essay(0)
- Multiple Choice(0)
- Short Answer(0)
- True False(0)
- Matching(0)