Exam 3: Demand and Supply
Exam 1: What Is Economics644 Questions
Exam 2: The Economic Problem503 Questions
Exam 3: Demand and Supply558 Questions
Exam 4: Measuring Gdp and Economic Growth375 Questions
Exam 5: Monitoring Jobs and Inflation434 Questions
Exam 6: Economic Growth450 Questions
Exam 7: Finance, Saving, and Investment260 Questions
Exam 8: Money, the Price Level, and Inflation616 Questions
Exam 9: The Exchange Rate and the Balance of Payments547 Questions
Exam 10: Aggregate Supply and Aggregate Demand452 Questions
Exam 11: Expenditure Multipliers: They Keynesian Model484 Questions
Exam 12: U.S. Inflation, Unemployment, and Business Cycle443 Questions
Exam 13: Fiscal Policy328 Questions
Exam 14: Monetary Policy284 Questions
Exam 15: International Trade Policy207 Questions
Select questions type
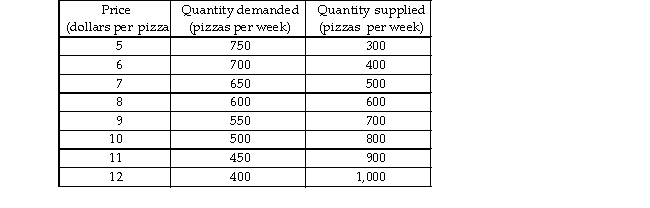 -A market research team has come up with the demand and supply schedules for pizza in Cheeseboro. These sch are given in the table above. Use these data to analyze the situation in the market for pizza.
a) Draw a figure showing the demand curve for pizza and the supply curve of pizza. What are the equilibrium and quantity?
b) Suppose the price is $10. Describe the situation in the market and explain how the price of pizza adjusts. No suppose the price is $6. Describe the situation in the market and explain how the price of pizza adjusts.
c) The market research report also includes a prediction about the effect on the market for pizza in Cheeseboro recent news published in Cheeseboro Herald. The Herald reported that pizza has been discovered to help preve diseases. Unfortunately, your dog chewed up the report and all you can read about the prediction is "quantity... by 150 at each price." What does the prediction say? Use your graph to show the predicted effects on the market for pizza. What are the predicted equilibrium price and quantity? How will the market adjust?
-A market research team has come up with the demand and supply schedules for pizza in Cheeseboro. These sch are given in the table above. Use these data to analyze the situation in the market for pizza.
a) Draw a figure showing the demand curve for pizza and the supply curve of pizza. What are the equilibrium and quantity?
b) Suppose the price is $10. Describe the situation in the market and explain how the price of pizza adjusts. No suppose the price is $6. Describe the situation in the market and explain how the price of pizza adjusts.
c) The market research report also includes a prediction about the effect on the market for pizza in Cheeseboro recent news published in Cheeseboro Herald. The Herald reported that pizza has been discovered to help preve diseases. Unfortunately, your dog chewed up the report and all you can read about the prediction is "quantity... by 150 at each price." What does the prediction say? Use your graph to show the predicted effects on the market for pizza. What are the predicted equilibrium price and quantity? How will the market adjust?
(Essay)
4.9/5  (35)
(35)
The quantity supplied of a good or service is the amount that
(Multiple Choice)
4.7/5 (34)
When demand increases, the equilibrium price _ and the equilibrium quantity _.
(Multiple Choice)
4.8/5 (40)
Which of the following shifts the supply curve for oranges?
(Multiple Choice)
4.7/5 (43)
Sweatshirts and tee- shirts are complements in consumption and the price of a sweatshirt increases. As a result, the demand for
(Multiple Choice)
4.7/5 (37)
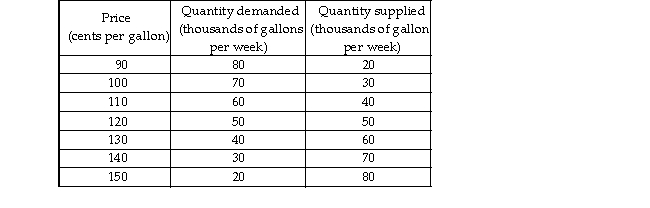 -A market research team has come up with the demand and supply schedules for gasoline in Motorville in the tab above. Use these data to analyze the situation in the market for gas in Motorville.
a) Draw a figure showing the demand curve for gasoline and the supply curve of gasoline. What are the equili price and quantity?
b) Suppose the price is $1.30. Describe the situation in the market and explain how the market adjusts. Now su the price is $1.00. Describe the situation in the market and explain how the market adjusts.
c) The market research report also predicts that a rise in the price of crude oil will decrease the quantity of gas by 20,000 gallons a week at each price. Suppose the price of crude oil does rise. Use your figure to show how this affect the market for gas. How will the market adjust? What will be the new equilibrium price and quantity?
-A market research team has come up with the demand and supply schedules for gasoline in Motorville in the tab above. Use these data to analyze the situation in the market for gas in Motorville.
a) Draw a figure showing the demand curve for gasoline and the supply curve of gasoline. What are the equili price and quantity?
b) Suppose the price is $1.30. Describe the situation in the market and explain how the market adjusts. Now su the price is $1.00. Describe the situation in the market and explain how the market adjusts.
c) The market research report also predicts that a rise in the price of crude oil will decrease the quantity of gas by 20,000 gallons a week at each price. Suppose the price of crude oil does rise. Use your figure to show how this affect the market for gas. How will the market adjust? What will be the new equilibrium price and quantity?
(Essay)
4.9/5 (32)
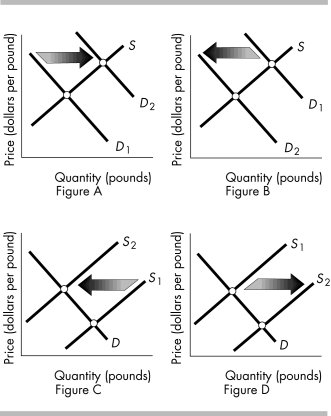 -The above figures show the market for oranges. Which figure shows the effect of great growing conditions that produce an above- average sized crop?
(Multiple Choice)
4.7/5 (39)
Coffee and sugar are complements. If the supply curve of coffee shifts leftward because of poor weather, then there will be
(Multiple Choice)
4.8/5 (37)
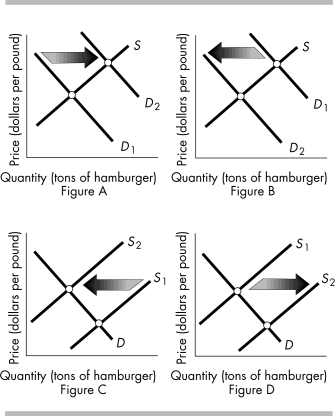 -The above figures show the market for hamburger meat. Which figure(s) shows the effect of an increase in the number of people who eat hamburger meat?
(Multiple Choice)
4.9/5 (36)
In early 2007 the price of computer memory chips rose. In a demand and supply model, shifts in what curve(s) could have brought about the higher price?
(Essay)
4.7/5 (42)
By itself, an increase in the number of suppliers in a market results in a
(Multiple Choice)
4.9/5 (35)
If the price of a hot dog is $2 and the price of a hamburger is $4, then the
(Multiple Choice)
4.9/5 (38)
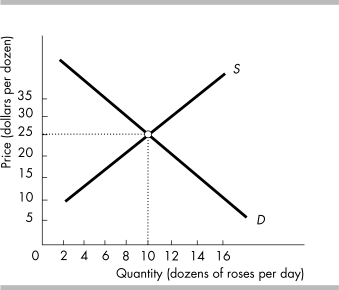 -In the above figure, a price of $15 per dozen for roses would result in
(Multiple Choice)
4.8/5 (29)
A change in which of the following shifts the demand curve?
(Multiple Choice)
4.8/5 (38)
The equilibrium price will fall and the equilibrium quantity might increase, decrease, or stay the same when the
(Multiple Choice)
4.9/5 (40)
The law of demand concludes that a rise in the price of a golf ball the quantity demanded and .
(Multiple Choice)
4.7/5 (32)
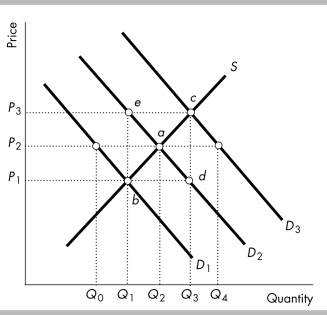 -In the above figure, a change in quantity supplied with unchanged supply is represented by a movement from
(Multiple Choice)
4.9/5 (35)
What is the difference between a money price and a relative price? When the demand and supply model predicts that the price of coffee will rise, is the model predicting that the money price rises or the relative price rises?
(Essay)
4.9/5 (39)
When the price of a normal good falls, the substitution effect leads to _ in the quantity purchased and the income effect leads to in the quantity purchased.
(Multiple Choice)
4.9/5 (41)
Filters
- Essay(0)
- Multiple Choice(0)
- Short Answer(0)
- True False(0)
- Matching(0)