Exam 3: Demand and Supply
Exam 1: What Is Economics472 Questions
Exam 2: The Economic Problem432 Questions
Exam 3: Demand and Supply503 Questions
Exam 4: Measuring Gdp and Economic Growth393 Questions
Exam 5: Monitoring Jobs and Inflation398 Questions
Exam 6: Economic Growth343 Questions
Exam 7: Finance, Saving, and Investment233 Questions
Exam 8: Money, the Price Level, and Inflation583 Questions
Exam 9: The Exchange Rate and the Balance of Payments482 Questions
Exam 10: Aggregate Supply and Aggregate Demand411 Questions
Exam 11: Expenditure Multipliers: the Keynesian Model444 Questions
Exam 12: U.S Inflation, Unemployment, and Business Cycle391 Questions
Exam 13: Fiscal Policy251 Questions
Exam 14: Monetary Policy216 Questions
Exam 15: International Trade Policy187 Questions
Review101 Questions
Select questions type
Gruel is an inferior good. Hence, a decrease in peopleʹs incomes
(Multiple Choice)
4.9/5  (32)
(32)
For consumers, goods A and B are complementary goods. The cost of a resource used in the production of A decreases. As a result,
(Multiple Choice)
4.8/5 (37)
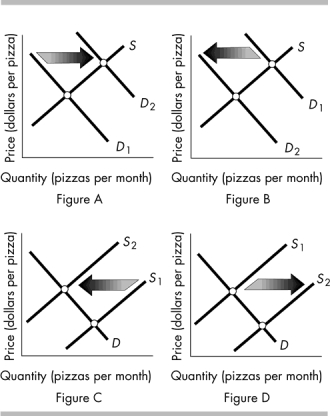 -The above figure shows the market for pizza. Which figure shows the effect of an increase in the price of the tomato sauce used to produce pizza?
(Multiple Choice)
4.7/5 (40)
The price of a bag of corn chips is $3, and the price of a bottle of soda is $1. What is the relative price of a bag of corn chips?
(Multiple Choice)
4.8/5 (41)
Price (dollars per pound of cat food) Quantity demanded (tons of cat food per year) Quantity supplied (tons of cat food per year) 1.00 52 15 1.50 46 26 2.00 43 34 2.50 40 30 3.00 35 44
-The above table gives the demand and supply schedules for cat food. If the supply increases by 20 tons at every price, what is the new equilibrium price and quantity?
(Essay)
4.8/5 (34)
Which of the following explains why supply curves slope upward?
(Multiple Choice)
5.0/5 (46)
If the quantity of textbooks supplied is 10,000 per year and the quantity of textbooks demanded is 8,000 per year, there is a ____________in the market and the price will _________.
(Multiple Choice)
4.8/5 (42)
Which of the following shifts the supply curve for gasoline rightward?
(Multiple Choice)
4.7/5 (43)
If shoes rise in price, the demand curve for shoes ___________and the quantity of shoes demanded________
(Multiple Choice)
4.7/5 (37)
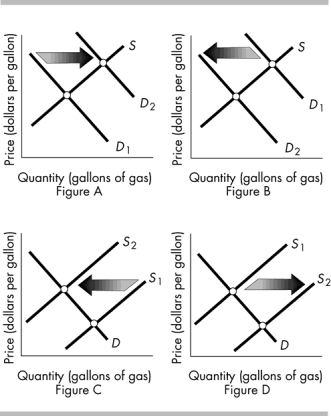 -The above figures show the market for gasoline. Which figures) shows the effect of a new U.S. tax on oil that suppliers must pay?
(Multiple Choice)
4.8/5 (33)
If the demand and supply curves are described by the following equations P=a-bQ and P=c+dQ, respectively, the equilibrium price is P*=ad+bc)/b+d) .
(True/False)
4.7/5 (34)
Your friend Tony opened a pizzeria. You helped him to advertise his pizza, which is in fact the best pizza in town. As a result, the demand for Tonyʹs pizza increases and your friend, noticing lines of customers, raises the price of his pizza. But then he fears that the higher price will cause demand to decline, which will cause the price to drop. Is Tony right in his analysis of the situation? Explain.
(Essay)
4.9/5 (42)
When peopleʹs incomes increase, the demand for a good increases. The good is called
(Multiple Choice)
4.8/5 (35)
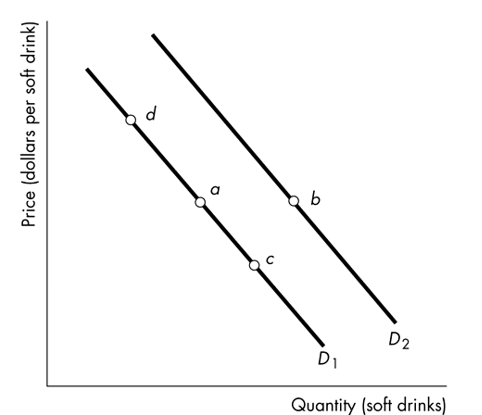 -Consider the demand curves for soft drinks shown in the figure above. Suppose the economy is at point a. An increase in the price of a soda results in a movement to a point such as
(Multiple Choice)
4.9/5 (33)
Ticket scalpers at the NCAA basketball tournament last year charged prices high above the printed ticket price. This observation is evidence of
(Multiple Choice)
4.8/5 (38)
Which of the following increases the equilibrium price of a used car and decreases the equilibrium quantity?
(Multiple Choice)
4.8/5 (29)
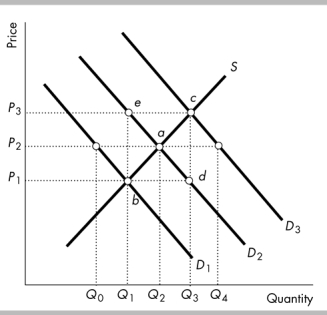 -In the above figure, if D2 is the original demand curve and the price of a substitute in consumption rises, which price and quantity might result?
(Multiple Choice)
4.9/5 (41)
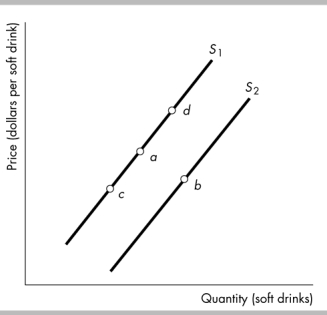 -The figure above shows supply curves for soft drinks. Suppose the economy is at point a. A movement to point d would be the result of
(Multiple Choice)
4.8/5 (31)
Filters
- Essay(0)
- Multiple Choice(0)
- Short Answer(0)
- True False(0)
- Matching(0)