Exam 12: The Business Cycle, Inflation, and Deflation
Exam 1: What Is Economics170 Questions
Exam 2: The Economic Problem145 Questions
Exam 3: Demand and Supply185 Questions
Exam 4: Measuring Gdp and Economic Growth126 Questions
Exam 5: Monitoring Jobs and Inflation113 Questions
Exam 6: Economic Growth95 Questions
Exam 7: Finance, Saving, and Investment138 Questions
Exam 8: Money, the Price Level, and Inflation129 Questions
Exam 9: The Exchange Rate and the Balance of Payments121 Questions
Exam 10: Aggregate Supply and Aggregate Demand129 Questions
Exam 11: Expenditure Multipliers166 Questions
Exam 12: The Business Cycle, Inflation, and Deflation105 Questions
Exam 13: Fiscal Policy96 Questions
Exam 14: Monetary Policy93 Questions
Exam 15: International Trade Policy119 Questions
Select questions type
Use the figure below to answer the following questions.
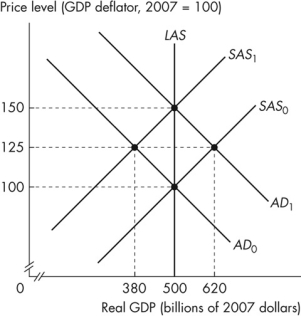 Figure 12.2.3
-Refer to Figure 12.2.3.Assume that the figure illustrates an economy initially in equilibrium at the intersection of the SAS0 curve and the AD0 curve.If the aggregate demand curve is correctly expected to shift to AD1, new equilibrium real GDP is _______ and the new equilibrium price level is _______.
Figure 12.2.3
-Refer to Figure 12.2.3.Assume that the figure illustrates an economy initially in equilibrium at the intersection of the SAS0 curve and the AD0 curve.If the aggregate demand curve is correctly expected to shift to AD1, new equilibrium real GDP is _______ and the new equilibrium price level is _______.
(Multiple Choice)
4.8/5  (37)
(37)
A correctly anticipated increase in the quantity of money, in an economy with an unchanging long- run aggregate supply, will result in
(Multiple Choice)
4.9/5 (35)
When the price level is rising and, simultaneously, real GDP is decreasing,
(Multiple Choice)
4.7/5 (36)
Use the figure below to answer the following questions.
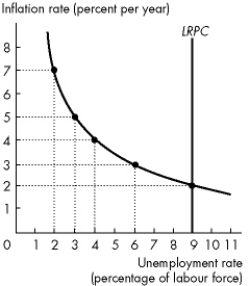 Figure 12.4.1
-Refer to Figure 12.4.1.The figure illustrates an economy's Phillips curves.What is the natural unemployment rate?
Figure 12.4.1
-Refer to Figure 12.4.1.The figure illustrates an economy's Phillips curves.What is the natural unemployment rate?
(Multiple Choice)
4.8/5 (36)
Use the figure below to answer the following questions.
Figure 12.4.1
-Refer to Figure 12.4.1.The figure illustrates an economy's Phillips curves.If the current inflation rate is 3 percent a year, what is the current unemployment rate?
(Multiple Choice)
4.7/5 (34)
Which of the following are business cycle theories that regard fluctuations in aggregate demand as the factor tha business cycles? I.Keynesian cycle theory
II.real business cycle theory
III.monetarist cycle theory
(Multiple Choice)
4.7/5 (46)
Use the figure below to answer the following question.
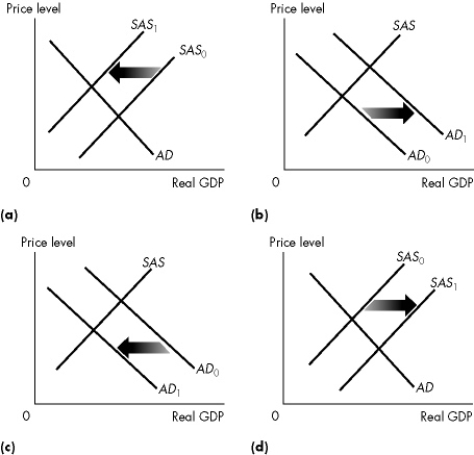 Figure 12.2.5
-Refer to Figure 12.2.5.Which one of the graphs in the figure represents an economy experiencing stagflation?
Figure 12.2.5
-Refer to Figure 12.2.5.Which one of the graphs in the figure represents an economy experiencing stagflation?
(Multiple Choice)
4.7/5 (48)
Use the figure below to answer the following questions.
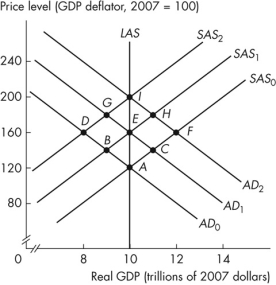 Figure 12.2.6
-Refer to Figure 12.2.6.Starting at point A, the initial effect of a cost- push inflation is a move to point _______.As a cost- push inflation spiral proceeds, it follows the path _______.
Figure 12.2.6
-Refer to Figure 12.2.6.Starting at point A, the initial effect of a cost- push inflation is a move to point _______.As a cost- push inflation spiral proceeds, it follows the path _______.
(Multiple Choice)
4.8/5 (28)
The new classical theory argues that the primary factor leading to business cycles is
(Multiple Choice)
4.8/5 (47)
According to the real business cycle theory, what effects follow from a change in productivity? I.Investment demand changes.
II.The demand for labour changes.
III.Government expenditure changes.
(Multiple Choice)
5.0/5 (38)
Use the figure below to answer the following questions.
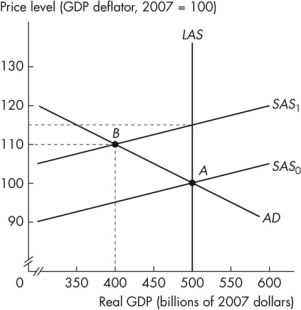 Figure 12.2.2
-Refer to Figure 12.2.2.If the short- run aggregate supply curve does not shift, and remains at SAS0, then the expected inflation rate is
Figure 12.2.2
-Refer to Figure 12.2.2.If the short- run aggregate supply curve does not shift, and remains at SAS0, then the expected inflation rate is
(Multiple Choice)
4.8/5 (42)
The economy starts out at a full- employment equilibrium.Some events then occur that generate a demand- pull inflation.All of the following events except an increase in _______ might start a demand- pull inflation.
(Multiple Choice)
4.9/5 (38)
The short- run Phillips curve shows the relationship between _______, holding constant the expected inflation rate and the natural unemployment rate.
(Multiple Choice)
4.8/5 (36)
Use the table below to answer the following questions.
Table 12.4.1 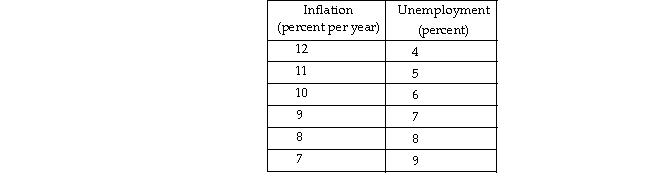 -Refer to Table 12.4.1.The table gives points on a short- run Phillips curve.If the expected inflation rate is 10 percent, and the inflation rate unexpectedly rises to 12 percent and stays there for some period of time, the expected inflation rate becomes _______ percent a year and the natural unemployment rate is _______ percent.
(Multiple Choice)
4.9/5 (34)
Use the figure below to answer the following questions.
Figure 12.2.2
-Refer to Figure 12.2.2.If SAS shifts from SAS0 to SAS1, then
(Multiple Choice)
4.8/5 (37)
Filters
- Essay(0)
- Multiple Choice(0)
- Short Answer(0)
- True False(0)
- Matching(0)