Exam 9: Aggregate Demand and Aggregate Supply
Exam 1: Introduction: What Is Economics144 Questions
Exam 2: The Key Principles of Economics195 Questions
Exam 3: Exchange and Markets135 Questions
Exam 4: Demand, Supply, and Market Equilibrium279 Questions
Exam 5: Measuring a Nations Production and Income161 Questions
Exam 6: Unemployment and Inflation206 Questions
Exam 7: The Economy at Full Employment165 Questions
Exam 8: Why Do Economies Grow203 Questions
Exam 9: Aggregate Demand and Aggregate Supply189 Questions
Exam 10: Fiscal Policy166 Questions
Exam 11: The Income-Expenditure Model265 Questions
Exam 12: Investment and Financial Markets179 Questions
Exam 13: Money and the Banking System184 Questions
Exam 14: The Federal Reserve and Monetary Policy203 Questions
Exam 15: Modern Macroeconomics: From the Short Run to the Long Run176 Questions
Exam 16: The Dynamics of Inflation and Unemployment186 Questions
Exam 17: Macroeconomic Policy Debates143 Questions
Exam 18: International Trade and Public Policy226 Questions
Exam 19: The World of International Finance189 Questions
Select questions type
An increase in government expenditure has a multiplier effect on aggregate demand due to:
(Multiple Choice)
4.9/5  (33)
(33)
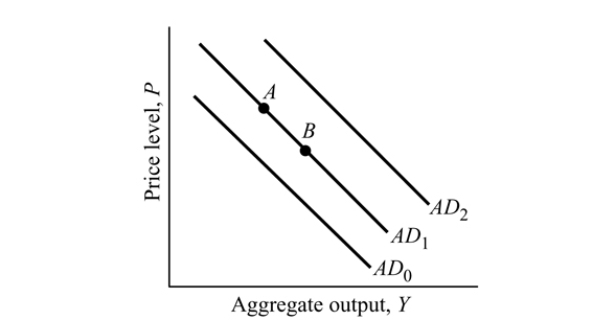 Figure 9.1
-Refer to Figure 9.1. An increase in the money supply causes:
Figure 9.1
-Refer to Figure 9.1. An increase in the money supply causes:
(Multiple Choice)
4.9/5 (39)
If the economy is in long run equilibrium at full employment, an increase in the money supply will lead to a higher aggregate demand and a higher output level in the long- run.
(True/False)
4.8/5 (43)
The aggregate supply curve in the short run is different from the aggregate supply curve in the long run because of:
(Multiple Choice)
4.8/5 (44)
An increase in the price level results in a decline in aggregate demand because people's "net worth" decreases and will spend less. This effect is called the:
(Multiple Choice)
4.9/5 (37)
In the short run, an increase in the money supply will lead to a higher aggregate demand and a higher price level.
(True/False)
4.7/5 (46)
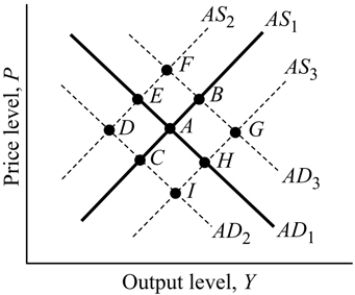 Figure 9.6
-Refer to Figure 9.6. In the short run, a large decrease in oil prices will would move the equilibrium to:
Figure 9.6
-Refer to Figure 9.6. In the short run, a large decrease in oil prices will would move the equilibrium to:
(Multiple Choice)
4.7/5 (37)
As the marginal propensity to consume increases, the value of the multiplier
(Multiple Choice)
4.8/5 (31)
In the long run, higher taxes will lead to a lower price level and a lower level of real GDP.
(True/False)
4.8/5 (32)
In the short run, an increase in the price of a major input such as oil will:
(Multiple Choice)
4.8/5 (42)
The aggregate demand curve that shows the _______ relationship between the price level and the quantity of real GDP demanded.
(Multiple Choice)
4.9/5 (38)
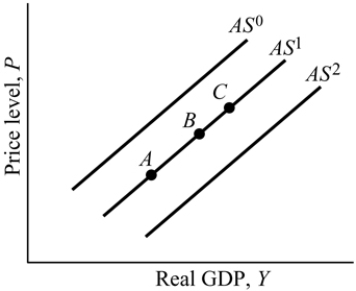 Figure 9.5
-Refer to Figure 9.5. Suppose the economy is a point B. A large _______ in the price level will move the economy to _______ .
Figure 9.5
-Refer to Figure 9.5. Suppose the economy is a point B. A large _______ in the price level will move the economy to _______ .
(Multiple Choice)
4.9/5 (36)
A large increase in oil prices will cause the aggregate supply curve to shift left.
(True/False)
4.9/5 (37)
The aggregate supply curve depicts the relationship between:
(Multiple Choice)
4.8/5 (34)
Define the aggregate demand curve. Explain the impact of an increase in the price level on the quantity of real GDP demanded.
(Essay)
5.0/5 (36)
The curve that depicts aggregate demand slopes downward because:
(Multiple Choice)
4.9/5 (45)
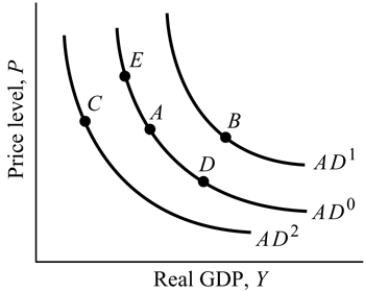 Figure 9.2
-Refer to Figure 9.2. Suppose the economy is at Point A, a decrease in taxes causes a movement to Point:
Figure 9.2
-Refer to Figure 9.2. Suppose the economy is at Point A, a decrease in taxes causes a movement to Point:
(Multiple Choice)
4.8/5 (40)
Suppose there are three economies with 3 different consumption functions: Country A: C = 100 + 0.8Y Country B: C = 200 + 0.75 Y
Country C: C = 75 + 0.9Y
In which of these countries is the multiplier the largest?
(Multiple Choice)
4.9/5 (46)
Filters
- Essay(0)
- Multiple Choice(0)
- Short Answer(0)
- True False(0)
- Matching(0)