Exam 5: An Introduction To Macroeconomics
Exam 1: What Is Economics226 Questions
Exam 2: The Economy Myth and Reality152 Questions
Exam 3: The Fundamental Economic Problem Scarcity and Choice250 Questions
Exam 4: Supply and Demand An Initial Look298 Questions
Exam 5: An Introduction To Macroeconomics215 Questions
Exam 6: The Goals Of Macroeconomic Policy211 Questions
Exam 7: Economic Growth Theory And Policy228 Questions
Exam 8: Aggregate Demand and The Powerful Consumer218 Questions
Exam 9: Demand Side Equilibrium Unemployment Or Inflation 212 Questions
Exam 10: Bringing In The Supply Side Unemployment and Inflation 228 Questions
Exam 11: Managing Aggregate Demand Fiscal Policy209 Questions
Exam 12: Money and The Banking System222 Questions
Exam 13: Monetary Policy Conventional and Unconventional204 Questions
Exam 14: The Financial Crisis and The Great Recession61 Questions
Exam 15: The Debate Over Monetary and Fiscal Policy215 Questions
Exam 16: Budget Deficits In The Short and Long Run210 Questions
Exam 17: The Trade Off Between Inflation and Unemployment219 Questions
Exam 18: International Trade and Comparative Advantage207 Questions
Exam 19: The International Monetary System Order Or Disorder 217 Questions
Exam 20: Exchange Rates and The Macroeconomy209 Questions
Select questions type
Aggregate demand and supply curves have been widely used to analyze the performance of the macroeconomy.Figure 5-3 shows four diagrams that represent different changes in the macroeconomy.Choose the diagram that best represents the situations described in the following questions.
Figure 5-3 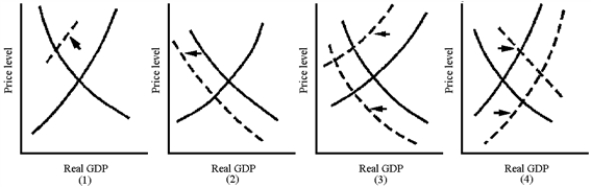 -Which graph in Figure 5-3 best represents the economic conditions of the American economy in 2001?
(Multiple Choice)
4.8/5  (38)
(38)
Microeconomics focuses on ____; macroeconomics concentrates on ____.
(Multiple Choice)
4.8/5 (29)
Abstract terms like "cost of living" and "price level" are meaningless to ordinary individuals.
(True/False)
4.7/5 (32)
If hot dogs cost $2 this year and $3 next year,then 100 hotdogs will contribute
(Multiple Choice)
4.9/5 (43)
If aggregate demand keeps shifting rightward month after month and aggregate supply remains constant,the economy will experience a recession.
(True/False)
4.8/5 (28)
Aggregation involves adding together different products and services.
(True/False)
4.9/5 (37)
You are a collector of antique coins.You purchase a silver dollar minted in 1898.Is this sale included in GDP for the current year?
(Multiple Choice)
4.8/5 (32)
Real GDP differs from nominal GDP in that nominal GDP measures
(Multiple Choice)
4.7/5 (32)
Aggregate demand and supply curves have been widely used to analyze the performance of the macroeconomy.Figure 5-3 shows four diagrams that represent different changes in the macroeconomy.Choose the diagram that best represents the situations described in the following questions.
Figure 5-3
-Which graph in Figure 5-3 best represents the favorable macroeconomy of the late 1990s?
(Multiple Choice)
4.9/5 (34)
China is the world's largest wheat producer.If China's domestic product grew by eleven percent in the previous year,it implies that
(Multiple Choice)
5.0/5 (36)
John Maynard Keynes wrote The General Theory of Employment,Interest,and Money (1936)to
(Multiple Choice)
4.9/5 (39)
Define and distinguish between real and nominal GDP.Explain why the distinction is important to economists.
(Essay)
4.9/5 (32)
How does the calculation of GDP include the costs of natural resource depletion that occurs when output is produced?
(Multiple Choice)
4.8/5 (34)
Describe some of the steps used to combat inflation.What are their side-effects?
(Essay)
4.7/5 (29)
The stagflation in the United States during the 1974-1975 period can be attributed to
(Multiple Choice)
4.9/5 (29)
During the Great Depression of the 1930s,unemployment peaked at _____%.
(Multiple Choice)
4.8/5 (31)
The first year of the Bush administration in 2001 could be represented as a(n)
(Multiple Choice)
5.0/5 (39)
Aggregate demand and supply curves have been widely used to analyze the performance of the macroeconomy.Figure 5-3 shows four diagrams that represent different changes in the macroeconomy.Choose the diagram that best represents the situations described in the following questions.
Figure 5-3
-Which graph in Figure 5-3 best represents the aggregate demand-induced Great Depression of the 1930s?
(Multiple Choice)
4.7/5 (24)
Filters
- Essay(0)
- Multiple Choice(0)
- Short Answer(0)
- True False(0)
- Matching(0)