Exam 4: Supply and Demand An Initial Look
Exam 1: What Is Economics226 Questions
Exam 2: The Economy Myth and Reality152 Questions
Exam 3: The Fundamental Economic Problem Scarcity and Choice250 Questions
Exam 4: Supply and Demand An Initial Look298 Questions
Exam 5: An Introduction To Macroeconomics215 Questions
Exam 6: The Goals Of Macroeconomic Policy211 Questions
Exam 7: Economic Growth Theory And Policy228 Questions
Exam 8: Aggregate Demand and The Powerful Consumer218 Questions
Exam 9: Demand Side Equilibrium Unemployment Or Inflation 212 Questions
Exam 10: Bringing In The Supply Side Unemployment and Inflation 228 Questions
Exam 11: Managing Aggregate Demand Fiscal Policy209 Questions
Exam 12: Money and The Banking System222 Questions
Exam 13: Monetary Policy Conventional and Unconventional204 Questions
Exam 14: The Financial Crisis and The Great Recession61 Questions
Exam 15: The Debate Over Monetary and Fiscal Policy215 Questions
Exam 16: Budget Deficits In The Short and Long Run210 Questions
Exam 17: The Trade Off Between Inflation and Unemployment219 Questions
Exam 18: International Trade and Comparative Advantage207 Questions
Exam 19: The International Monetary System Order Or Disorder 217 Questions
Exam 20: Exchange Rates and The Macroeconomy209 Questions
Select questions type
Figure 4-16 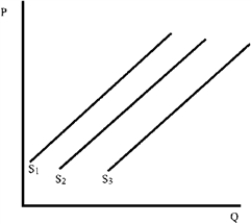 -Assume that Figure 4-16 shows the supply of steak.An increase in the price of pork will change the supply from
(Multiple Choice)
5.0/5  (37)
(37)
The government of Economica announces that it will purchase its farmers' surplus of milk.From this announcement,you can infer that Economica has a
(Multiple Choice)
4.7/5 (38)
Rent controls are most often designed to protect the investment made by apartment building owners.
(True/False)
4.7/5 (38)
An increase in the number of downed trees led to an increase in the demand for chain saws.When demand increases and supply is unchanged,equilibrium price and quantity increase (Figure 4-24)."Gouging" may be nothing more than a higher equilibrium price due to an increase in demand.
Figure 4-24 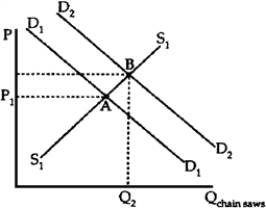 -After Hurricane Andrew hit Florida and Louisiana,consumers expressed outrage at the high prices being charged for chainsaws,generators,and bottled water.If governments followed the consumers' demands and imposed price ceilings in these markets,what is the likely result?
(Essay)
4.9/5 (33)
The removal in 1966 of the requirement that Catholics eat fish on Fridays was followed by a 12.5 percent fall in prices of fresh fish.From this it can be deduced that the
(Multiple Choice)
4.9/5 (34)
A demand schedule relates prices of a particular good to quantities demanded.
(True/False)
5.0/5 (37)
A supply schedule can be plotted on a graph to yield a supply curve.
(True/False)
4.8/5 (35)
A demand schedule is a table showing how the ____ of some product during a specified period of time changes as ____ changes,holding all other determinants of quantity demanded constant.
(Multiple Choice)
4.7/5 (37)
The demand curve for a good connects points describing how much consumers
(Multiple Choice)
4.8/5 (33)
Figure 4-2 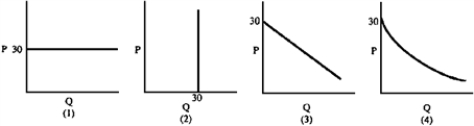 -If the government has stated that it will buy any amount of good X offered at $30,which demand curve in Figure 4-2 is appropriate?
(Multiple Choice)
4.8/5 (36)
Figure 4-14 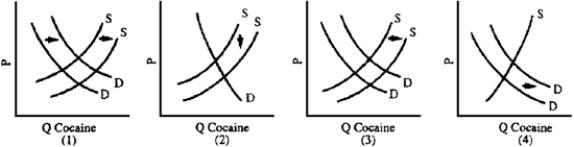 -Frustrated by the cost and ineffectiveness of the war on drugs,the U.S.government could consider "decriminalization" of the use and sale of cocaine.Critics contend that lower prices will expand drug use and that decriminalization will remove the stigma and danger from arrest associated with drug use,thus further increasing the demand and number of addicts.Which graph in Figure 4-14 best illustrates the critics' case?
(Multiple Choice)
4.7/5 (35)
Figure 4-12 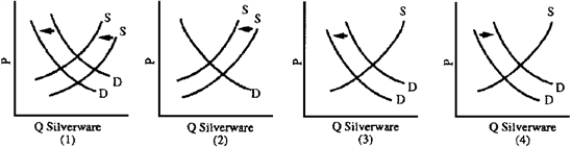 -The price of gasoline has risen and the quantity sold has fallen.This was likely caused by
(Multiple Choice)
4.9/5 (37)
Figure 4-20 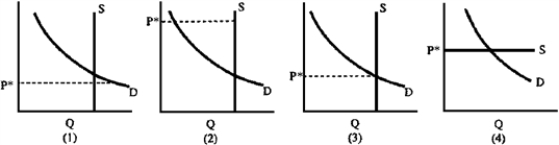 -The presence of scalpers (people selling tickets at a price above the quoted price,P*)at a recent Super Bowl game suggests that the market for stadium seats could be represented by which graph in Figure 4-20?
(Multiple Choice)
4.9/5 (34)
Filters
- Essay(0)
- Multiple Choice(0)
- Short Answer(0)
- True False(0)
- Matching(0)