Exam 7: GDP and the CPI: Tracking the Macroeconomy
Exam 1: First Principles183 Questions
Exam 2: Economic Models: Trade-Offs and Trade341 Questions
Exam 3: Supply and Demand230 Questions
Exam 4: Price Controls and Quotas: Meddling With Markets187 Questions
Exam 5: International Trade224 Questions
Exam 6: Macroeconomics: the Big Picture128 Questions
Exam 7: GDP and the CPI: Tracking the Macroeconomy213 Questions
Exam 8: Unemployment and Inflation300 Questions
Exam 9: Long-Run Economic Growth268 Questions
Exam 10: Savings, Investment Spending, and the Financial Syst355 Questions
Exam 11: Income and Expenditure114 Questions
Exam 12: Aggregate Demand and Aggregate Supply308 Questions
Exam 13: Fiscal Policy120 Questions
Exam 14: Money, Banking, and the Federal Reserve System135 Questions
Exam 15: Monetary Policy316 Questions
Exam 16: Inflation, Disinflation, and Deflation194 Questions
Exam 17: Macroeconomics: Events and Ideas283 Questions
Exam 18: International Macroeconomics411 Questions
Select questions type
Use the following to answer questions: 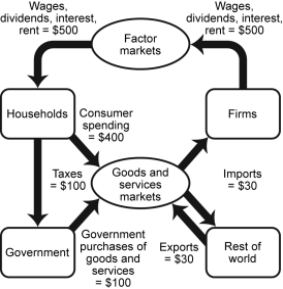 -(Figure 7-1: Circular-Flow Model) Use Figure 7-1: Circular-Flow Model. What is the value of GDP in this economy?
(Multiple Choice)
5.0/5  (44)
(44)
Suppose a consumer buys a Perfect Pizza frozen cheese pizza at the grocery store for $10. Perfect Pizza purchased the dough and tomato sauce from a food-processing company for $2 and bought the cheese for $1. It sold the pizza to the store for $5. How much has GDP increased?
(Multiple Choice)
4.8/5 (43)
Use the following to answer questions: 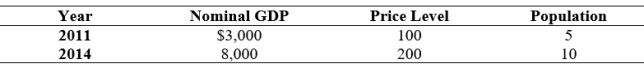 -(Table: Per Capita GDP) Use Table: Per Capita GDP. The growth rate of nominal GDP from 2011 to 2014 was _____%.
(Multiple Choice)
4.8/5 (33)
Use the following to answer questions:
-(Figure 7-1: Circular-Flow Model) Use Figure 7-1: Circular-Flow Model. If the circular-flow model is in equilibrium (the sum of money flowing into each box is equal to the sum of the money flowing out of it) and there is an increase in government spending, holding everything else constant, which outcome is likely to occur?
(Multiple Choice)
4.8/5 (34)
Use the following to answer questions:
-(Table: Per Capita GDP) Use Table: Per Capita GDP. The growth rate of real GDP from 2011 to 2014 was:
(Multiple Choice)
4.9/5 (39)
If the price level and nominal GDP both doubled, then real GDP would:
(Multiple Choice)
4.9/5 (41)
If real GDP falls while nominal GDP rises, then prices on average have:
(Multiple Choice)
4.8/5 (47)
Use the following to answer questions: 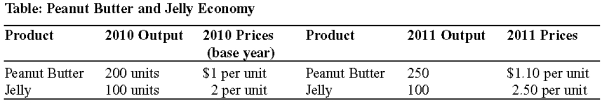 -(Table: Peanut Butter and Jelly Economy) Use Table: Peanut Butter and Jelly Economy. Between 2010 and 2011, nominal GDP _____ by _____%.
(Multiple Choice)
4.9/5 (35)
The national income and product accounts are calculated by the:
(Multiple Choice)
4.9/5 (33)
If, during 2011, the Republic of Sildavia recorded a GDP of $65 billion, interest payments of $15 billion, imports of $13 billion, profits of $7 billion, exports of $15 billion, and rent of $7 billion, wages during 2011 in Sildavia were:
(Multiple Choice)
4.8/5 (36)
Use the following to answer questions:
-(Table: Peanut Butter and Jelly Economy) Use Table: Peanut Butter and Jelly Economy. Nominal GDP in 2010 was:
(Multiple Choice)
4.8/5 (33)
Use the following to answer questions: 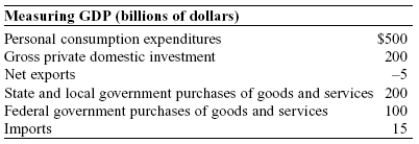 -(Table: Measuring GDP) Use Table: Measuring GDP. Total expenditures on GDP by the household sector are:
(Multiple Choice)
4.9/5 (35)
Use the following to answer questions:
-(Table: Per Capita GDP) Use Table: Per Capita GDP. If 2011 is the base year, real GDP in 2011 was:
(Multiple Choice)
4.9/5 (40)
Use the following to answer questions: 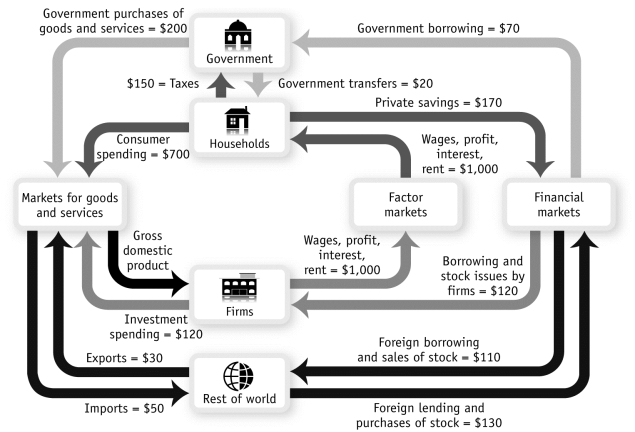 -(Figure 7-2: Expanded Circular-Flow Model) Use Figure 7-2: Expanded Circular-Flow Model How much is total government spending?
(Multiple Choice)
4.9/5 (40)
Use the following to answer questions: 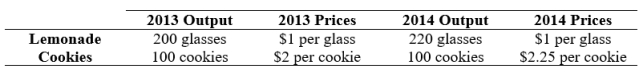 -(Table: Lemonade and Cookies) Use Table: Lemonade and Cookies. Assume that an economy produces only lemonade and cookies. Nominal GDP in 2013 was:
(Multiple Choice)
4.7/5 (29)
Filters
- Essay(0)
- Multiple Choice(0)
- Short Answer(0)
- True False(0)
- Matching(0)