Exam 3: Averages and Variation
Exam 1: Getting Started10 Questions
Exam 2: Organizing Data23 Questions
Exam 3: Averages and Variation26 Questions
Exam 4: Correlation and Regression17 Questions
Exam 5: Elementary Probability Theory33 Questions
Exam 6: The Binomial Probability Distribution and Related Topics38 Questions
Exam 7: Normal Curves and Sampling Distributions46 Questions
Exam 8: Estimation9 Questions
Exam 9: Hypothesis Testing17 Questions
Exam 10: Inferences About Differences11 Questions
Exam 11: Additional Topics Using Inference25 Questions
Select questions type
What percentage of the general U.S. population have bachelor's degrees? Suppose that the Statistical Abstract of the United States, 120th Edition, gives the following percentage of bachelor's degrees by state. For convenience, the data are sorted in increasing order. Illinois has a bachelor's degree percentage rate of about 18%. Into what quartile does this rate fall?
17 18 18 18 19 20 20 20 21 21 21 21 21 22 22 22 22 22 23 23 24 24 24 24 24 25 25 25 25 26 26 26 26 26 26 27 27 27 28 28 28 29 29 31 31 32 32 34 35 38
Free
(Multiple Choice)
4.9/5  (39)
(39)
Correct Answer: Verified
B
Do bonds reduce the overall risk of an investment portfolio? Let x be a random variable representing annual percent return for the Vanguard Total Stock Index (all Stocks). Let y be a random variable representing annual return for the Vanguard Balanced Index (60% stock and 40% bond). For the past several years, assume the following data. The sample means for x and y are 11.00 and 8.90, respectively.
x: 12 0 37 24 32 26 27 -12 -12 -24 y: 9 -3 26 15 25 18 15 -3 -4 -9 Compute the coefficient of variation for each fund. Round your answers to the nearest tenth.
Free
(Multiple Choice)
4.7/5 (40)
Correct Answer:Verified
E
Do bonds reduce the overall risk of an investment portfolio? Let x be a random variable representing annual percent return for the Vanguard Total Stock Index (all Stocks). Let y be a random variable representing annual return for the Vanguard Balanced Index (60% stock and 40% bond). For the past several years, assume the following data. Compute. x: 14 0 36 24 31 26 27 -14 -14 -24 y: 8 -1 26 17 25 18 17 -1 -2 -8
Free
(Multiple Choice)
4.8/5 (43)
Correct Answer:Verified
B
Find the range for the following sample data. x: 24 18 15 31 29
(Multiple Choice)
4.9/5 (35)
Find the sample variance for the following sample data. Round your answer to the nearest hundredth. x: 24 16 13 31 28
(Multiple Choice)
4.8/5 (29)
Do bonds reduce the overall risk of an investment portfolio? Let x be a random variable representing annual percent return for the Vanguard Total Stock Index (all Stocks). Let y be a random variable representing annual return for the Vanguard Balanced Index (60% stock and 40% bond). For the past several years, assume the following data. Compute the coefficient of variation for each fund. Round your answers to the nearest tenth. x: 12 0 38 23 34 25 26 -12 -12 -23 y: 10 -5 28 15 24 16 15 -5 -6 -10
(Multiple Choice)
4.9/5 (30)
The Grand Canyon and the Colorado River are beautiful, rugged, and sometimes dangerous. Assume there is a physician at the park clinic in Grand Canyon Village. Suppose the physician has recorded (for a 5-year period) the number of visitor injuries at different landing points for commercial boat trips down the Colorado River in both the Upper and Lower Grand Canyon. Compute a 5% trimmed mean for Upper Canyon and Lower Canyon. Round your answer to the nearest thousandth. Upper Canyon: Number of injuries per Landing Point Between North Canyon and Phantom Ranch 4 5 3 3 5 6 7 10 5 3 5
Lower Canyon: Number of injuries per Landing Point Between Bright Angel and Lava Falls
9 3 3 0 7 8 4 12 5 0 3 11 4 3
(Multiple Choice)
4.8/5 (40)
In your biology class, your final grade is based on several things: a lab score, score on two major tests, and your score on the final exam. There are 100 points available for each score. However, the lab score is worth 20% of your total grade, each major test is worth 27.5%, and the final exam is worth 25%. Compute the weighted average for the following scores: 91 on the lab, 83 on the first major test, 92 on the second major test, and 84 on the final exam. Round your answer to the nearest hundredth.
(Multiple Choice)
4.7/5 (31)
Do bonds reduce the overall risk of an investment portfolio? Let x be a random variable representing annual percent return for the Vanguard Total Stock Index (all Stocks). Let y be a random variable representing annual return for the Vanguard Balanced Index (60% stock and 40% bond). For the past several years, assume the following data. Compute a 75% Chebyshev interval around the mean for x-values and also for y-values. Round your answers to the nearest hundredth. x: 12 0 39 24 33 26 27 -12 -12 -24 y 8 -5 28 15 25 18 15 -5 -6 -8
(Multiple Choice)
4.9/5 (43)
Do bonds reduce the overall risk of an investment portfolio? Let x be a random variable representing annual percent return for the Vanguard Total Stock Index (all Stocks). Let y be a random variable representing annual return for the Vanguard Balanced Index (60% stock and 40% bond). For the past several years, assume the following data. The sample means for x and y are 10.40 and 9.20, respectively.
x: 13 0 36 22 32 24 25 -13 -13 -22 y: 7 -2 27 16 23 17 16 -2 -3 -7 Compute a 75% Chebyshev interval around the mean for x-values and also for y-values. Round your answers to the nearest hundredth.
(Multiple Choice)
4.8/5 (43)
At Center Hospital there is some concern about the high turnover of nurses. A survey was done to determine how long (in months) nurses had been in their current positions. The responses (in months) of 20 nurses were A box-and-whisker plot of the data is shown below.
24 2 5 16 26 37 28 48 14 8 6 24 32 27 29 11 22 33 9 37 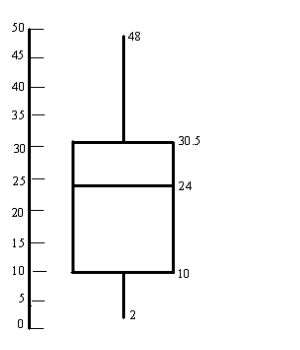 Find the interquartile range.
(Multiple Choice)
4.8/5 (39)
Suppose automobile insurance companies gave annual premiums for top-rated companies in several states. The figure below shows box plots for the annual premium for urban customers in three states. 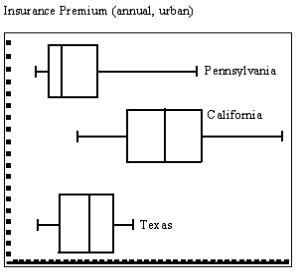 Which state has the highest median premium?
(Multiple Choice)
4.8/5 (36)
Given the sample data below, use the defining formula to compute the sample standard deviation. 28 32 15 29 19 14
(Multiple Choice)
4.7/5 (38)
Do bonds reduce the overall risk of an investment portfolio? Let x be a random variable representing annual percent return for the Vanguard Total Stock Index (all Stocks). Let y be a random variable representing annual return for the Vanguard Balanced Index (60% stock and 40% bond). For the past several years, assume the following data. Compute. x: 12 0 37 24 35 26 27 -12 -12 -24 y: 8 -5 28 15 25 16 15 -5 -6 -8
(Multiple Choice)
4.9/5 (30)
Suppose automobile insurance companies gave annual premiums for top-rated companies in several states. The figure below shows box plots for the annual premium for urban customers in three states. 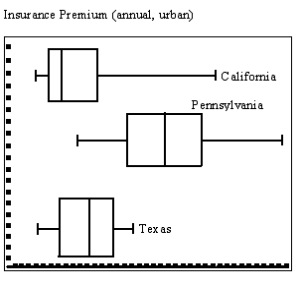 Which state has the smallest interquartile range?
(Multiple Choice)
4.7/5 (40)
Do bonds reduce the overall risk of an investment portfolio? Let x be a random variable representing annual percent return for the Vanguard Total Stock Index (all Stocks). Let y be a random variable representing annual return for the Vanguard Balanced Index (60% stock and 40% bond). For the past several years, assume the following data. Compute. x: 14 0 38 23 33 25 26 -14 -14 -23 y: 9 -5 28 17 24 16 17 -5 -6 -9
(Multiple Choice)
4.7/5 (38)
Suppose automobile insurance companies gave annual premiums for top-rated companies in several states. The figure below shows box plots for the annual premium for urban customers in three states. 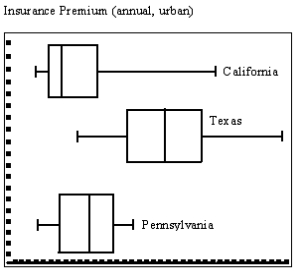 Which state offers the lowest premium? Which state offers the highest premium?
(Multiple Choice)
4.9/5 (34)
Compute the population variance for the following sample data, assuming the sample comprises the entire population. Round your answer to the nearest hundredth. x: 21 20 11 35 26
(Multiple Choice)
4.9/5 (30)
How hot does it get in Death Valley? Assume that the following data are taken from a study conducted by the National Park System, of which Death Valley is a unit. The ground temperatures were taken from May to November in the vicinity of Furnace Creek. Compute the median for these ground temperatures. Round your answer to the nearest tenth. 148 153 167 172 196 178 193 196 178 178 167 162 153 145
(Multiple Choice)
4.8/5 (33)
The Grand Canyon and the Colorado River are beautiful, rugged, and sometimes dangerous. Assume there is a physician at the park clinic in Grand Canyon Village. Suppose the physician has recorded (for a 5-year period) the number of visitor injuries at different landing points for commercial boat trips down the Colorado River in both the Upper and Lower Grand Canyon. The mean, median, and mode for Upper Canyon are 5.091, 5.0, and 5, respectively.
Upper Canyon: Number of injuries per Landing Point Between
North Canyon and Phantom Ranch
4 5 3 3 5 6 7 10 5 3 5
Lower Canyon: Number of injuries per Landing Point Between
Bright Angel and Lava Falls
9 3 3 0 7 8 4 12 5 0 3 11 4 3 The mean, median, and mode for Lower Canyon are 5.214, 4.0, and 3, respectively.
Compare the mean, median, and mode found in Upper Canyon and Lower Canyon, respectively.
(Multiple Choice)
4.8/5 (38)
Filters
- Essay(0)
- Multiple Choice(0)
- Short Answer(0)
- True False(0)
- Matching(0)