Exam 2: Scarcity and the World of Trade-Offs
Exam 1: The Nature of Economics347 Questions
Exam 2: Scarcity and the World of Trade-Offs411 Questions
Exam 3: Demand and Supply448 Questions
Exam 4: Extensions of Demand and Supply Analysis399 Questions
Exam 5: Public Spending and Public Choice359 Questions
Exam 6: Funding the Public Sector202 Questions
Exam 19: Demand and Supply Elasticity413 Questions
Exam 20: Consumer Choice457 Questions
Exam 21: Rents, Profits, and the Financial Environment of Business445 Questions
Exam 22: The Firm: Cost and Output Determination387 Questions
Exam 23: Perfect Competition431 Questions
Exam 24: Monopoly386 Questions
Exam 25: Monopolistic Competition309 Questions
Exam 26: Oligopoly and Strategic Behavior302 Questions
Exam 27: Regulation and Antitrust Policy in a Globalized Economy309 Questions
Exam 28: The Labor Market: Demand, Supply and Outsourcing374 Questions
Exam 29: Unions and Labor Market Monopoly Power316 Questions
Exam 30: Income, Poverty, and Health Care302 Questions
Exam 31: Environmental Economics299 Questions
Exam 32: Comparative Advantage and the Open Economy313 Questions
Exam 33: Exchange Rates and the Balance of Payments300 Questions
Select questions type
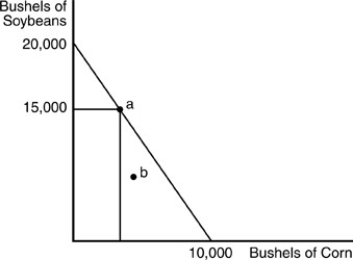 -In the above figure, what is the opportunity cost of one bushel of soybeans?
(Multiple Choice)
4.9/5  (43)
(43)
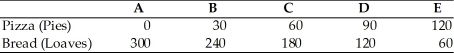 The above table shows the daily production possibilities for a bakery.
Currently the bakery bakes 60 pizzas and 180 loaves of bread, that is-it is at alternative C.
-Using the above table, what is the opportunity cost of moving from alternative C to alternative B?
The above table shows the daily production possibilities for a bakery.
Currently the bakery bakes 60 pizzas and 180 loaves of bread, that is-it is at alternative C.
-Using the above table, what is the opportunity cost of moving from alternative C to alternative B?
(Multiple Choice)
4.8/5 (39)
 -Refer to the above figure. Which of the following statements is true?
(Multiple Choice)
4.9/5 (33)
Education increases the stock of which factor of production?
(Multiple Choice)
4.9/5 (35)
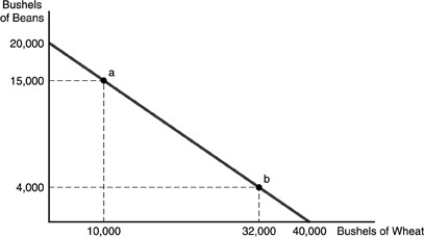 -Refer to the above figure. A farmer has 50 acres of land on which to grow wheat or beans. An acre of land yields 400 bushels of beans or 800 bushels of wheat. Which of the following is a possible combination of beans and wheat that can be grown, assuming the land is farmed efficiently?
(Multiple Choice)
4.9/5 (29)
How can the concepts of opportunity costs, scarcity and choice by illustrated by the production possibilities curve?
(Essay)
4.8/5 (32)
A point outside a production possibilities curve indicates
(Multiple Choice)
4.9/5 (29)
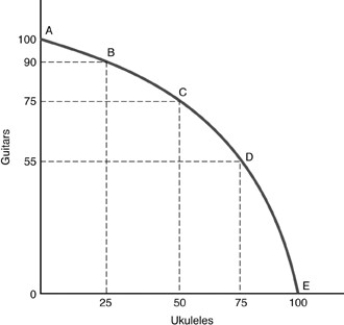 -In the above figure, the opportunity cost of moving from point D to point C is
(Multiple Choice)
4.8/5 (35)
 -In the above figure, the opportunity cost of moving from producing 75 guitars and 25 ukuleles to producing 50 guitars and 50 ukuleles is
(Multiple Choice)
4.8/5 (36)
Suppose the current unemployment rate is 15 percent. If it rises to 20 percent,
(Multiple Choice)
4.8/5 (40)
A waitress brings a free glass of wine when you sit down in a restaurant. This glass of wine is
(Multiple Choice)
4.9/5 (31)
Economic growth can be pictured in a production possibilities curve diagram by
(Multiple Choice)
4.9/5 (41)
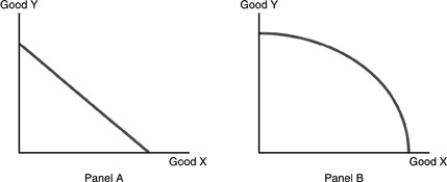
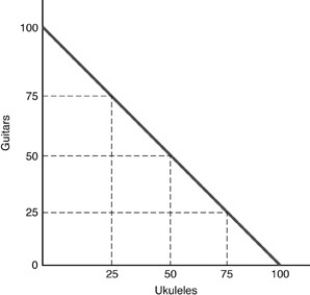
If the production possibilities curve is a downward sloping straight line, then
(Multiple Choice)
4.8/5 (32)
By going to school an individual will obtain which resource?
(Multiple Choice)
4.9/5 (40)
Filters
- Essay(0)
- Multiple Choice(0)
- Short Answer(0)
- True False(0)
- Matching(0)