Exam 12: Financial Statement Analysis
The following are the comparative financial statements for Opus Corporation for 2020 and 2019: 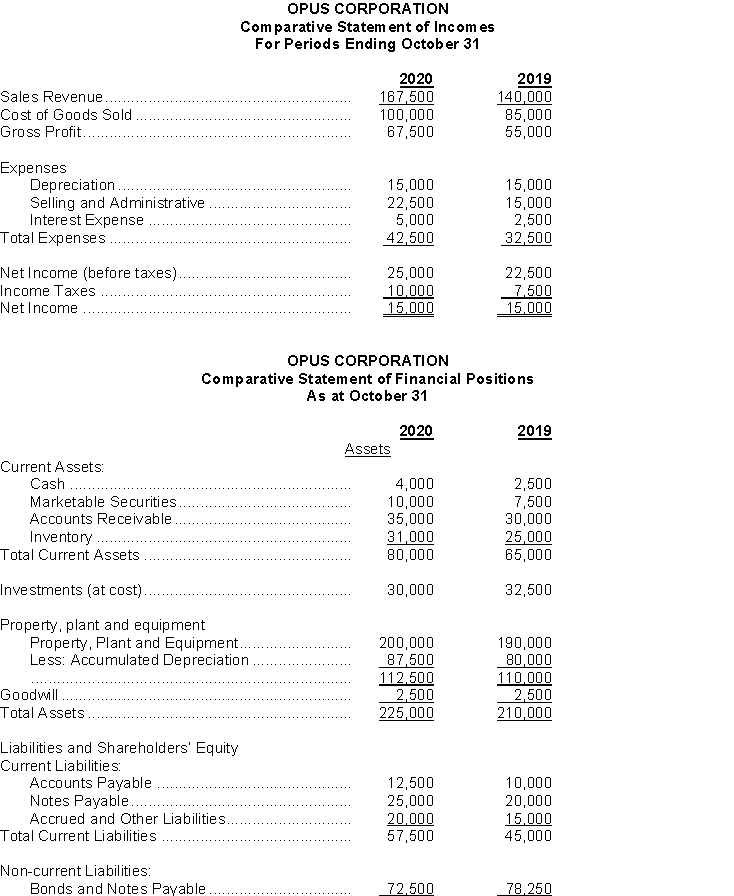 Instructions
Comment on the financial performance of OPUS Corp. in terms of
a) Liquidity
b) Activity
c) Profitability
d) Solvency
Instructions
Comment on the financial performance of OPUS Corp. in terms of
a) Liquidity
b) Activity
c) Profitability
d) Solvency
a) Liquidity
Current Ratio = 80,000 / 57,500 = 1.39 in 2020, 65,000 / 45,000 = 1.44 in 2019.
Quick Ratio = (80,000 - 31,000) / 57,500 = 0.85 in 2020, (65,000 - 25,000) / 5,000 =.89 in 2019.
Both the current and quick ratios are fairly stable from year to year but slightly below the ideal of a 2:1 current ratio and 1:1 quick ratio. Further analysis should be done comparing these ratios to industry averages.
b) Activity Ratios 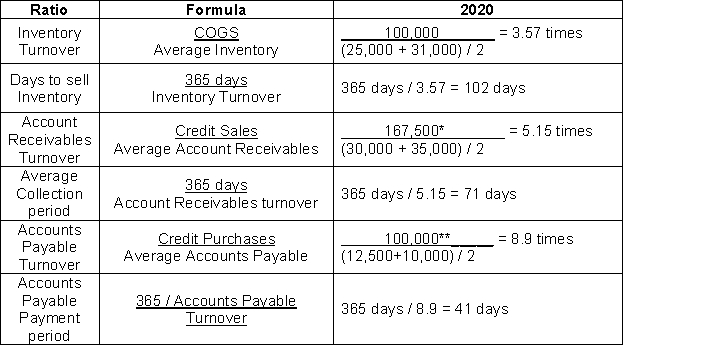 * this assumes that all sales were made on credit.
**assumes all COGS relates to credit purchases
Inventory is turning over less than 4 times per year. This may be an indicator of a problem depending what type of industry Opus is in. Accounts receivable are only being collected every 71 days. This is far too long. Opus's receivable policies and procedures should be reviewed. Both inventory and receivables are tying up the company's cash and could contribute to future cash shortfalls.
Suppliers are being paid every 41 days; this is not too bad depending on the company credit terms with suppliers. Again more questions need to be asked and further analysis should be undertaken.
c) Profitability Ratios
Gross Profit Margin = 67,500 / 167,500 x 100 = 40% in 2020, 55,000 / 140,000 x 100 = 39.3% in 2019.
Net Profit Margin = 15,000 / 167,500 x 100 = 9.0% in 2020, 15,000 / 140,000 x 100 = 10.7% in 2019.  The gross profit margin has gone up slightly from 2019 to 2020 and net income has declined by nearly 2%. While variable costs have gone down slightly, there has been an increase in operating expenses in 2020.
Both the ROE and ROA are strong and provide a strong return for shareholders on their investment and for the company in terms of the use of its assets.
d) Solvency Ratios
Debt to Total Equity: 130,000 = 1.37
95,000
The company has $1.37 in debt for every $1 in shareholders' equity. This ratio measures how much a company is borrowing in relation to the amount of equity invested in it. Again lenders will want to see lower ratios.
Interest Coverage: (15,000 + 10,000 + 5,000 + 15,000) / 5,000 = 9, or in other words the company generates sufficient net income to cover the interest payments 9 times. This would provide a lender with a reasonable margin of safety.
Cross-sectional analysis involves examining a company's financial data
C
Common-size analysis is useful for making comparisons across the various financial statements.
False
In accounting terms, the different business activities that the firm engages in or the different geographic regions it does business in are referred to as
Lonesome Inc. had the following activity during 2020:  The interest coverage ratio during 2020 is
Retrospective analysis reviews past trends in order to help predict the future.
To see if a company's cost of sales is increasing proportionately with sales, an analyst would use
The price investors are willing to pay for a dollar's worth of earnings is the
To best interpret the accounts receivable turnover ratio, the days in accounts receivable should be compared to the company's
Which of the following best represents a low-cost producer?
Selected data for Ocean Fish Sales appear below: 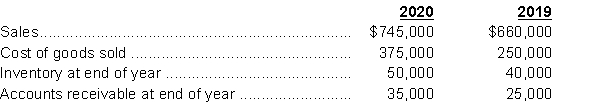 All sales are made on credit.
Instructions
Calculate the following ratios for 2020:
(a) Inventory turnover
(b) Days in inventory
(c) Receivables turnover
(d) Average collection period
All sales are made on credit.
Instructions
Calculate the following ratios for 2020:
(a) Inventory turnover
(b) Days in inventory
(c) Receivables turnover
(d) Average collection period
Filters
- Essay(0)
- Multiple Choice(0)
- Short Answer(0)
- True False(0)
- Matching(0)