Exam 12: Voting Methods
Exam 1: Problem Solving33 Questions
Exam 2: Set71 Questions
Exam 3: Logic80 Questions
Exam 4: Numeration Systems84 Questions
Exam 5: The Real Number System133 Questions
Exam 6: Topics in Algebra99 Questions
Exam 7: Consumer Mathematics125 Questions
Exam 8: Measurement92 Questions
Exam 9: Geometry36 Questions
Exam 10: Probability and Counting Techniques93 Questions
Exam 11: Statistics95 Questions
Exam 12: Voting Methods102 Questions
Exam 13: Graph Theory58 Questions
Exam 14: Available Online: Other Mathematical Systems27 Questions
Exam 15: Summary41 Questions
Select questions type
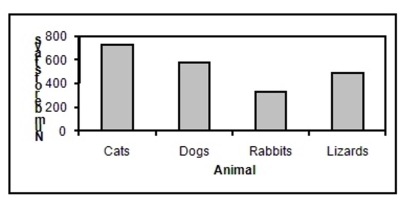
Construct a bar graph for the number of stray animals in a certain city. Animal Number of strays Cats 723 Dogs 576 Rabbits 328 Lizards 491
Free
(Essay)
4.9/5  (38)
(38)
Correct Answer: Verified
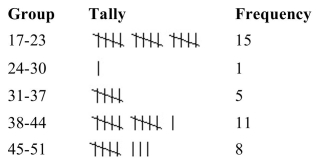
The ages of 40 community college students were gathered. Construct a frequency distribution for the data using five classes.
46 17 34 19 42 19 20 48 34 51 31 21 43 32 39 17 21 21 40 38 42 17 21 45 19 39 48 19 17 42 32 19 49 19 26 38 43 46 51 39
Free
(Essay)
4.7/5 (37)
Correct Answer:Verified
Find the value for the correlation coefficient r . x 10 8 7 12 14 5 y 20 19 17 25 28 9
Free
(Multiple Choice)
4.8/5 (48)
Correct Answer:Verified
B
To obtain the frequency distribution below, twenty-three babies were monitored for how many times they cried during the night. Construct a histogram for the data.
Class Frequency 0-2 4 3-5 6 6-8 9 9-11 3 12-14 1
(Essay)
4.8/5 (37)
Draw a scatter plot for the data shown. x 28 19 25 22 30 18 y 10 5 2 7 1 9
(Essay)
4.9/5 (40)
The average hourly wage of employees of a certain company is $13.74. Assume the variable is normally distributed. If the standard deviation is $4.25, find the probability that a randomly selected employee earns more than $20.54.
(Short Answer)
4.9/5 (33)
These data represent the number of gas stations along a certain 50-mile length of desert road. Draw a time series graph for the data.
Year 1971 1972 1973 1974 1975 Number 3 4 4 6 5
(Essay)
4.8/5 (33)
For the following data
(a) Draw a scatter plot.
(b) Find the value for .
(c) Test the significance of at the level and at the level.
(d) If is significant, find the regression line and draw the line on the scatter plot.
(e) Describe the nature of the relationship if one exists.
(f) Predict when .
x 10 8 15 14 20 17 y 114 108 77 87 75 94
(Essay)
4.9/5 (44)
For the 8 test scores shown, find the percentile rank of 68. 29 87 68 34 60 31 30 61
(Short Answer)
4.7/5 (39)
The exam grades of 31 students were used to obtain the frequency distribution below. Construct a histogram and frequency polygon for the data.
Class Frequency 40-49 1 50-59 2 60-69 5 70-79 12 80-89 7 90-99 4
(Essay)
4.9/5 (40)
Draw a scatter plot and describe the relationship. x 7 1 3 5 6 2 4 y 10 11 4 3 5 6 3
(Essay)
4.9/5 (37)
Find the equation of the regression line. x 10 8 7 12 14 5 y 20 19 17 25 28 9
(Multiple Choice)
4.8/5 (33)
Draw a scatter plot for the data shown
x 2 7 3 4 5 1 6 y 6 1 5 3 6 12 2
(Essay)
4.8/5 (34)
Fifty families reported their annual household income (in thousands of dollars). Construct a frequency distribution for the data using six classes.
41 18 104 36 29 62 53 65 80 99 23 55 32 44 67 21 89 31 57 70 15 92 76 38 56 23 17 150 34 87 95 76 21 33 59 88 102 34 51 73 16 95 41 72 18 23 76 59 42 95
(Essay)
4.9/5 (46)
The average hourly wage of employees of a certain company is $14.26. Assume the variable is normally distributed. If the standard deviation is $4.99, find the probability that a randomly selected employee earns less than $9.27.
(Multiple Choice)
4.7/5 (32)
Construct a stem and leaf plot for the following data using whole numbers as stems and the decimals as leaves.
5.3 2.4 7.1 4.8 6.2
3.1 7.8 6.4 2.7 2.5
7.1 3.6 5.9 5.4 3.2
4.4 7.6 2.5
(Essay)
4.9/5 (29)
Suppose the average size (in square feet) of homes in a certain region is 2101. Assume the variable is normally distributed with standard deviation 120. If a person in the region was intending to build a 2227 square foot home but downsized and built a 1873 square foot home, what was the change in percentile rank from the original plan to the actual home that was built?
(Multiple Choice)
4.8/5 (37)
Filters
- Essay(0)
- Multiple Choice(0)
- Short Answer(0)
- True False(0)
- Matching(0)