Exam 1: Algebra, Mathematical Models, and Problem Solving
Exam 1: Algebra, Mathematical Models, and Problem Solving181 Questions
Exam 2: Functions and Linear Functions138 Questions
Exam 3: Systems of Linear Equations104 Questions
Exam 4: Inequalities and Problem Solving100 Questions
Exam 5: Polynomials, Polynomial Functions, and Factoring127 Questions
Exam 6: Rational Expressions, Functions, and Equations102 Questions
Exam 7: Radicals, Radical Functions, and Rational Exponents98 Questions
Exam 8: Quadratic Equations and Functions115 Questions
Select questions type
Use the order of operations to simplify the expression.
-0 ÷ 5 + 2 ·7
(Multiple Choice)
4.8/5  (31)
(31)
Use the indicated property to write an algebraic expression equivalent to the given expression.
-8x + 20; commutative of addition
(Multiple Choice)
5.0/5 (30)
Use the order of operations to simplify the expression.
-4 · [2(2 - 6) - 3]
(Multiple Choice)
4.9/5 (33)
Divide as indicated or state that the division is undefined.
-
(Multiple Choice)
4.9/5 (31)
Match the story with the correct figure.
-The amount of rainfall as a function of time, if the rain fell more and more softly.
(Multiple Choice)
4.8/5 (26)
Solve.
-If a rock falls from a height of 80 meters above the ground, the height H (in meters) after x seconds is approximately H = 80 - 4.9x². What is the height of the rock after 2 seconds? (Round your answer to the nearest tenth.)
(Multiple Choice)
4.7/5 (29)
Solve the problem.
-The formula can be used to approximate the number, , (in millions) of laptops sold over a ten-year period, where is the number of years since the first year this information was recorded. According to this formula, how many laptops were sold in year 10 ? Round the answer to the nearest tenth of a million.
(Multiple Choice)
4.8/5 (39)
Express the interval in set builder notation and graph the interval on a number line.
-
![Express the interval in set builder notation and graph the interval on a number line. - [ - 4,7 ]](https://storage.examlex.com/TB6471/11ecba24_2dd3_8b34_8d7e_475bd2230e41_TB6471_00.jpg)
(Multiple Choice)
4.7/5 (38)
The line graph shows the recorded hourly temperatures in degrees Fahrenheit at an airport. 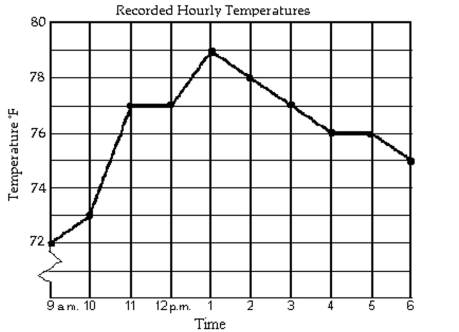 -During which hour did the temperature increase the most?
(Multiple Choice)
4.7/5 (37)
Filters
- Essay(0)
- Multiple Choice(0)
- Short Answer(0)
- True False(0)
- Matching(0)