Exam 3: Straight Lines and Linear Functions
Exam 1: Functions99 Questions
Exam 2: Graphical and Tabular Analysi99 Questions
Exam 3: Straight Lines and Linear Functions100 Questions
Exam 4: Exponential Functions100 Questions
Select questions type
Suppose is a linear function with and . Find an equation for .
(Multiple Choice)
4.7/5  (30)
(30)
Which of the tables below show linear data? Table 1
 Table 2
(Multiple Choice)
4.8/5 (34)
If a rock is thrown downward with an initial velocity of 8 feet per second, then its velocity , in feet per second, after  seconds is given by By how much does velocity increase over a 5-second period?
(Multiple Choice)
4.9/5 (36)
For a certain line, a run of 4 feet corresponds to a rise of 8 feet. What is the slope of this line?
(Multiple Choice)
4.8/5 (41)
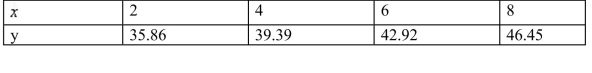
Find a linear model for the following data table. x 3 6 9 12 y 6 12 18 24
(Multiple Choice)
4.9/5 (32)
The following table shows the gross national product G , in trillions of dollars,  years after 2005. Use linear regression to model G as a function of
  .
. 
(Multiple Choice)
4.9/5 (39)
For a certain line, a run of 4 feet corresponds to a rise of 4 feet. What is the slope of this line?
(Multiple Choice)
4.9/5 (38)
A line through (8, 5) has slope 1.45. What is the vertical intercept?
(Multiple Choice)
4.8/5 (27)
We have $16.33 to spend on vegetable plants for our garden. Tomato plants cost $0.81 each, and pepper plants cost $0.38 each. There is space in the garden for 26 plants.
How many of each are bought?
(Multiple Choice)
4.8/5 (29)
Find a linear model for the following data table. x 1 3 5 7 y 7 11 15 19
(Multiple Choice)
4.9/5 (35)
At a distance 5 miles west of town, oil-bearing deposits are found 3044 feet deep. Also, 8 miles west of town, the oil is found 3164 feet down. Assuming the oil-bearing stratum lies on a straight line,
How deep would you expect to drill 10 miles west of town in order to find oil?
(Multiple Choice)
4.9/5 (38)
At a distance 5 miles west of town, oil-bearing deposits are found 3187 feet deep. Also, 8 miles west of town, the oil is found 3382 feet down. Assuming the oil-bearing stratum lies on a straight line,
How deep would you expect to drill 10 miles west of town in order to find oil?
(Multiple Choice)
4.8/5 (33)
The following table shows the number C , in millions, of cars sold in the U.S.  years after 2005. Use the regression line for the data to estimate the number of cars sold in 2011. t 0 1 3 5 C 5.55 5.48 5.21 4.56
(Multiple Choice)
4.7/5 (42)
The following table shows the running speed  , in centimeters per second, of ants as a func- tion of the temperature in degrees Celsius. Use linear regression to model running speed as a function of
Temperature. T 25.6 30.3 32.3 34.8 R 2.22 3.85 4.06 5.29
, in centimeters per second, of ants as a func- tion of the temperature in degrees Celsius. Use linear regression to model running speed as a function of
Temperature. T 25.6 30.3 32.3 34.8 R 2.22 3.85 4.06 5.29
(Multiple Choice)
4.8/5 (35)
Suppose is a linear function with and . Find an equation for .
(Multiple Choice)
4.8/5 (45)
Filters
- Essay(0)
- Multiple Choice(0)
- Short Answer(0)
- True False(0)
- Matching(0)