Exam 5: Elasticity and Its Application
Exam 1: Ten Principles of Economics110 Questions
Exam 2: Thinking Like an Economist103 Questions
Exam 3: Interdependence and the Gains From Trade110 Questions
Exam 4: The Market Forces of Supply and Demand152 Questions
Exam 5: Elasticity and Its Application133 Questions
Exam 6: Supply, Demand and Government Policies111 Questions
Exam 7: Consumers, Producers and the Efficiency of Markets127 Questions
Exam 8: Application: the Costs of Taxation105 Questions
Exam 9: Application: International Trade119 Questions
Exam 10: Externalities149 Questions
Exam 11: Public Goods and Common Resources136 Questions
Exam 12: The Design of the Tax System116 Questions
Exam 13: The Costs of Production141 Questions
Exam 14: Firms in Competitive Markets149 Questions
Exam 15: Monopoly159 Questions
Exam 16: Monopolistic Competition158 Questions
Exam 17: Oligopoly and Business Strategy135 Questions
Exam 18: Competition Policy78 Questions
Exam 19: The Markets for the Factors of Production143 Questions
Exam 20: Earnings and Discrimination145 Questions
Exam 21: Income Inequity and Poverty85 Questions
Exam 22: The Theory of Consumer Choice117 Questions
Exam 23: Frontiers of Microeconomics82 Questions
Select questions type
Suppose that after a five per cent increase in the price of timber, a forestry company increases its supply of timber by 10 per cent in the next three months, and 15 per cent by 12 months. This means that the elasticity of supply is _____.
(Multiple Choice)
4.8/5  (30)
(30)
What is the definition of the income elasticity of demand. What does it measure? How can it be used to determine whether a good is normal or inferior. What happens to the demand for an inferior good is income decreases?
(Essay)
4.9/5 (35)
If the demand for illegal drugs is inelastic, drug education campaigns should:
(Multiple Choice)
4.7/5 (28)
A government program that reduces land under cultivation hurts farmers but helps consumers.
(True/False)
4.7/5 (39)
The price of product X is reduced from $45 to $20 and, as a result, the quantity demanded increases from 20 to 25 units. From this we can conclude that the demand for X in this price range:
(Multiple Choice)
4.8/5 (38)
Graph 5-3
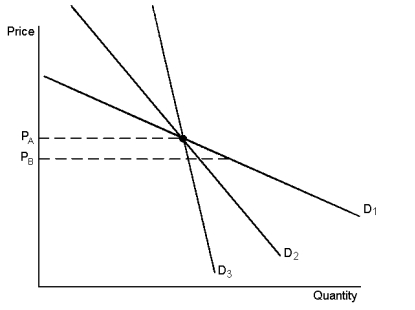 -In Graph 5-3, as price falls from PA to PB, which demand curve is most elastic?
(Multiple Choice)
4.9/5 (42)
If price changes and total revenue changes in the opposite direction, we can conclude that demand is relatively elastic.
(True/False)
4.9/5 (36)
Price elasticity of supply measures how much the quantity supplied responds to changes in demand.
(True/False)
4.8/5 (25)
Consider the following pairs of goods. Which would you expect to have the more elastic demand? Why?
a. water or diamonds
b. insulin or nasal decongestant spray
c. food in general or breakfast cereal
d. gasoline over the course of a week or gasoline over the course of a year
e. personal computers or IBM personal computers
(Essay)
4.9/5 (36)
Graph 5-4
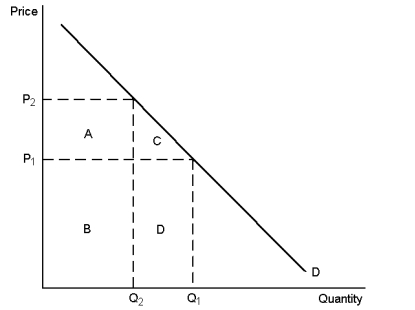 -Refer to Graph 5-4. The total revenue at P1 is represented by area(s):
(Multiple Choice)
4.8/5 (28)
As price elasticity of demand increases, the demand curve gets steeper and steeper.
(True/False)
4.8/5 (35)
Table 5-2
Quantities purchased
 -Refer to Table 5-2. Good Y is:
(Multiple Choice)
4.8/5 (40)
The income elasticity of demand is defined as the percentage change in quantity demanded divided by the percentage change in income.
(True/False)
4.9/5 (25)
The concept of the slope is the best way to measure the responsiveness of demand to changes in its determinants.
(True/False)
4.9/5 (31)
Suppose a producer is able to separate customers into two groups, one having a price inelastic demand and the other having a price elastic demand. If the producer's objective is to increase total revenue, she should:
(Multiple Choice)
4.8/5 (36)
The demand for basic foodstuffs such as rice or flour is usually elastic.
(True/False)
4.8/5 (25)
Graph 5-1
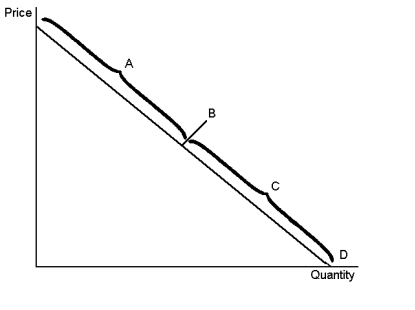 -In Graph 5-1, the section of the demand curve labelled A represents the:
(Multiple Choice)
4.8/5 (24)
Graph 5-5
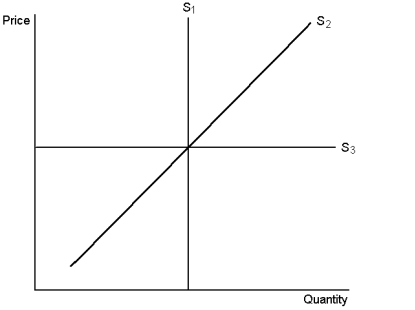 -In Graph 5-5, which supply curve is most likely the long-run supply curve?
(Multiple Choice)
4.8/5 (34)
Filters
- Essay(0)
- Multiple Choice(0)
- Short Answer(0)
- True False(0)
- Matching(0)