Exam 9: Applying the Competitive Model
Exam 1: Introduction59 Questions
Exam 2: Supply and Demand150 Questions
Exam 3: Applying the Supply-And-Demand Model124 Questions
Exam 4: Consumer Choice125 Questions
Exam 5: Applying Consumer Theory118 Questions
Exam 6: Firms and Production128 Questions
Exam 7: Costs122 Questions
Exam 8: Competitive Firms and Markets127 Questions
Exam 9: Applying the Competitive Model156 Questions
Exam 10: General Equilibrium and Economic Welfare122 Questions
Exam 11: Monopoly147 Questions
Exam 12: Pricing and Advertising135 Questions
Exam 13: Oligopoly and Monopolistic Competition128 Questions
Exam 14: Game Theory109 Questions
Exam 15: Factor Markets103 Questions
Exam 16: Interest Rates, Investments, and Capital Markets120 Questions
Exam 17: Uncertainty122 Questions
Exam 18: Externalities, Open-Access, and Public Goods123 Questions
Exam 19: Asymmetric Information119 Questions
Exam 20: Contracts and Moral Hazards107 Questions
Select questions type
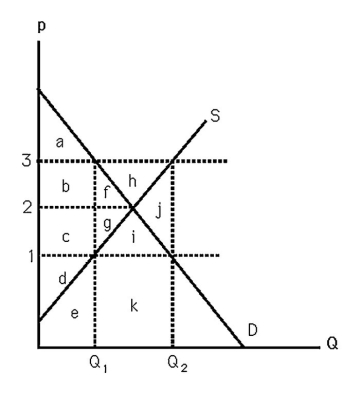 -The above figure shows supply and demand curves for milk. In an effort to help farmers, the government passes a law that establishes a $3 per gallon price support. As a result, consumer surplus falls by
(Multiple Choice)
4.9/5  (31)
(31)
Consumer surplus from a given purchase is the difference between what one was willing to pay for that purchase and what was actually paid.
(True/False)
4.9/5 (39)
If a market produces a level of output below the competitive equilibrium, then
(Multiple Choice)
4.9/5 (41)
The welfare loss of a tariff equals that of an import quota that leads to the same level of imports.
(True/False)
4.9/5 (37)
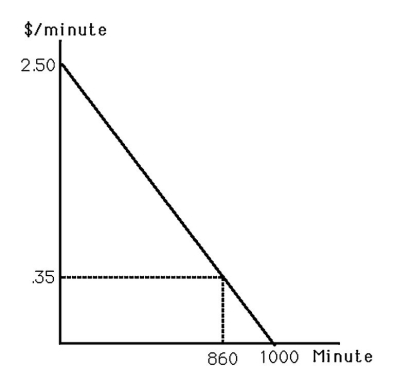 -The above figure shows the market demand curve for telecommunication while driving one's car (time spent on the car phone). If the price were $2.50, consumer surplus equals
(Multiple Choice)
4.9/5 (41)
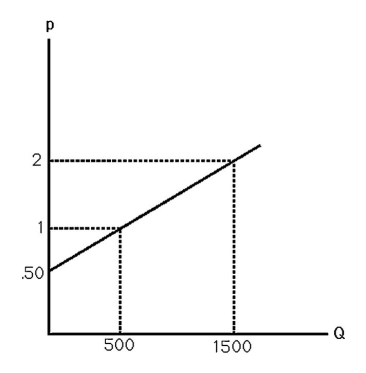 -Suppose the market supply curve for wheat is shown in the above figure. Calculate the producer surplus when price is $2 per bushel. If legislation mandates that the price be $1 per bushel, what is the resulting loss in producer surplus?
(Essay)
4.7/5 (29)
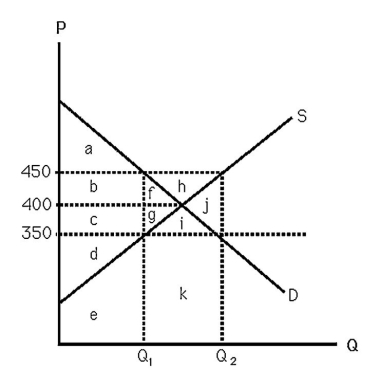 -The above figure shows supply and demand curves for apartment units in a large city. The area "e" represents
(Multiple Choice)
4.9/5 (34)
What is one reason existing firms might lobby the government to increase regulation in their industry?
(Multiple Choice)
4.9/5 (39)
Rent seeking in the form of lobbying for an increase in import tariffs by domestic producers
(Multiple Choice)
5.0/5 (44)
Assume a consumer has a horizontal demand curve for a product. His consumer surplus from buying the product
(Multiple Choice)
4.9/5 (24)
The difference between producer surplus and profit is always the associated with
(Multiple Choice)
4.8/5 (42)
A new law applied to a competitive market that requires laid off workers be paid a large severance payment will
(Multiple Choice)
4.8/5 (35)
As the quantity produced of a good increases, the social welfare generated by that good increases.
(True/False)
4.8/5 (27)
A ban on imports, a tariff, or a quota raises the price to domestic consumers. This means that consumers will buy less of the product at a higher price. The loss associated with this is called
(Multiple Choice)
4.9/5 (37)
-The above figure shows supply and demand curves for apartment units in a large city. If the city government passes a law that establishes $350 per month as the legal maximum rent, the consumer's net gain in surplus equals
(Multiple Choice)
4.7/5 (50)
In the long run, firms in a competitive market make zero economic profit. This induces most firms to leave the industry.
(True/False)
4.9/5 (40)
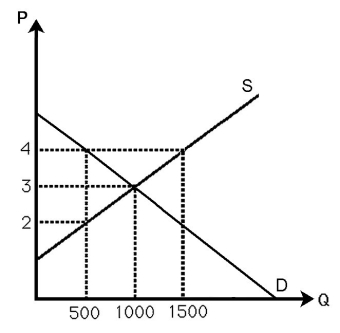 -The above figure shows the demand and supply curves in the market for milk. Currently the market is in equilibrium. If the government imposes a $2 per gallon tax to be collected from sellers, estimate the change in p, Q, and social welfare.
(Essay)
4.7/5 (39)
Explain why a government would impose an import tariff when domestic consumers suffer more than producers gain.
(Essay)
4.7/5 (39)
-The above figure shows supply and demand curves for milk. In an effort to help farmers, the government passes a law that establishes a $3 per gallon price support. To maintain the price support, government expenditures must equal
(Multiple Choice)
4.8/5 (45)
Filters
- Essay(0)
- Multiple Choice(0)
- Short Answer(0)
- True False(0)
- Matching(0)