Exam 7: Production, Inputs, and Cost: Building Blocks for Supply Analysis
Exam 1: What Is Economics?227 Questions
Exam 2: The Economy: Myth and Reality150 Questions
Exam 3: The Fundamental Economic Problem: Scarcity and Choice250 Questions
Exam 4: Supply and Demand: An Initial Look308 Questions
Exam 5: Consumer Choice: Individual and Market Demand202 Questions
Exam 6: Demand and Elasticity209 Questions
Exam 7: Production, Inputs, and Cost: Building Blocks for Supply Analysis216 Questions
Exam 8: Output, Price, and Profit: The Importance of Marginal Analysis189 Questions
Exam 9: Securities: Business Finance, and the Economy: The Tail that Wags the Dog?198 Questions
Exam 10: The Firm and the Industry under Perfect Competition208 Questions
Exam 11: Monopoly203 Questions
Exam 12: Between Competition and Monopoly225 Questions
Exam 13: Limiting Market Power: Regulation and Antitrust152 Questions
Exam 14: The Case for Free Markets I: The Price System220 Questions
Exam 15: The Shortcomings of Free Markets212 Questions
Exam 16: The Market's Prime Achievement: Innovation and Growth110 Questions
Exam 17: Externalities, the Environment, and Natural Resources217 Questions
Exam 18: Taxation and Resource Allocation219 Questions
Exam 19: Pricing the Factors of Production228 Questions
Exam 20: Labor and Entrepreneurship: The Human Inputs223 Questions
Exam 21: Poverty, Inequality, and Discrimination167 Questions
Exam 22: An Introduction to Macroeconomics211 Questions
Exam 23: The Goals of Macroeconomic Policy207 Questions
Exam 24: Economic Growth: Theory and Policy223 Questions
Exam 25: Aggregate Demand and the Powerful Consumer214 Questions
Exam 26: Demand-Side Equilibrium: Unemployment or Inflation?210 Questions
Exam 27: Bringing in the Supply Side: Unemployment and Inflation?223 Questions
Exam 28: Managing Aggregate Demand: Fiscal Policy205 Questions
Exam 29: Money and the Banking System219 Questions
Exam 30: Monetary Policy: Conventional and Unconventional205 Questions
Exam 31: The Financial Crisis and the Great Recession61 Questions
Exam 32: The Debate over Monetary and Fiscal Policy214 Questions
Exam 33: Budget Deficits in the Short and Long Run210 Questions
Exam 34: The Trade-Off between Inflation and Unemployment214 Questions
Exam 35: International Trade and Comparative Advantage226 Questions
Exam 36: The International Monetary System: Order or Disorder?213 Questions
Exam 37: Exchange Rates and the Macroeconomy214 Questions
Select questions type
Are returns to a single input and returns to scale one and the same? Explain.
(Essay)
4.9/5  (33)
(33)
Which of the following equations defines marginal revenue product?
(Multiple Choice)
4.8/5 (32)
Economies of scale lead to declining long-run average cost curves.
(True/False)
4.8/5 (37)
Figure 7-9
 -Of the graphs in Figure 7-9, which represents total fixed cost?
(Multiple Choice)
4.9/5 (37)
Figure 7-9
-Of the graphs in Figure 7-9, which represents average fixed cost?
(Multiple Choice)
4.9/5 (28)
The firm's average cost curve is the result of cost minimization in the use of fixed inputs.
(True/False)
4.9/5 (34)
Production technology determines the relationship of total cost to outputs.
(True/False)
4.8/5 (34)
The table below gives data on output for a firm in the short run.The firm is able to hire labor and its TPP is given.Compute the APP, MPP, and MRP for labor if the price of the good is fixed at $12 per unit.
1 4 2 9 3 15 4 21 5 26 6 30 7 33 8 35 9 36
(Essay)
4.9/5 (34)
Total physical product is maximized if marginal physical product is zero.
(True/False)
4.8/5 (33)
Figure 7-2
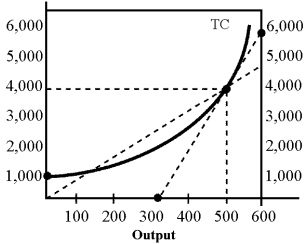 -In Figure 7-2 at an output of 500, marginal cost equals
(Multiple Choice)
4.8/5 (35)
If in some production range average cost is rising, the firm is experiencing
(Multiple Choice)
4.9/5 (34)
Which of the following is the correct statement of the marginal rule for optimal input proportions? The input proportion is optimal when
(Multiple Choice)
4.7/5 (34)
Figure 7-8
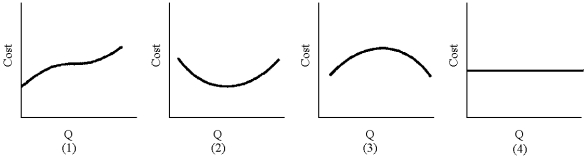 -Of the graphs in Figure 7-8, which represents total cost?
(Multiple Choice)
4.7/5 (26)
Table 7-1
1 5 2 12 3 22 4 30 5 35
-In Table 7-1, the average physical product after five workers are hired is
(Multiple Choice)
4.9/5 (32)
In which case will the transition from short run to long run involve the shortest chronological time?
(Multiple Choice)
5.0/5 (33)
Filters
- Essay(0)
- Multiple Choice(0)
- Short Answer(0)
- True False(0)
- Matching(0)