Exam 2: Solving Equations and Inequalities
Exam 1: Functions and Their Graphs150 Questions
Exam 2: Solving Equations and Inequalities144 Questions
Exam 3: Polynomial and Rational Functions150 Questions
Exam 4: Exponential and Logarithmic Functions150 Questions
Exam 5: Trigonometric Functions150 Questions
Exam 6: Analytic Trigonometry150 Questions
Exam 7: Additional Topics in Trigonometry150 Questions
Exam 8: Linear Systems and Matrices150 Questions
Exam 9: Sequences, Series, and Probability150 Questions
Exam 10: Topics in Analytic Geometry150 Questions
Exam 11: Algebraic Expressions and Equations149 Questions
Select questions type
The scatter plots of different data are shown below. Determine whether there is a positive correlation, negative correlation, or no discernible correlation between the variables. 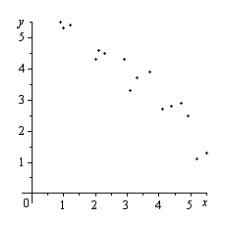
(Multiple Choice)
4.8/5  (42)
(42)
Determine any point(s) of intersection between the following equations. 
(Multiple Choice)
4.8/5 (39)
The average lengths L of cellular phone calls in minutes from 1999 to 2004 are shown in the table below.  Use the regression feature of a graphing utility to find a linear model for the data. Let t represent the year, with t = 9 corresponding to 1999. Use the model to predict the average lengths of cellular phone calls for the year 2010. Round your answer to two decimal places.
(Multiple Choice)
4.8/5 (39)
Use absolute value notation to define the interval shown below. 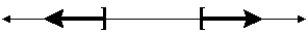 -1 9
-1 9
(Multiple Choice)
4.8/5 (37)
Determine whether there is positive correlation, negative correlation, or no discernible correlation between the variables shown in the scatter plot below. 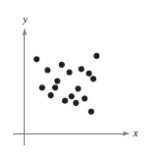
(Multiple Choice)
4.9/5 (29)
Which of the following is a zero of the given function? 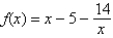
 ,
,  ,
,  ,
, 
(Multiple Choice)
4.8/5 (38)
Solve the inequality  and write the solution set in interval notation.
(Multiple Choice)
4.9/5 (39)
Given the following equation, set  and solve the resulting equation.
(Multiple Choice)
4.8/5 (32)
The average lengths L of cellular phone calls in minutes from 1999 to 2004 are shown in the table below. 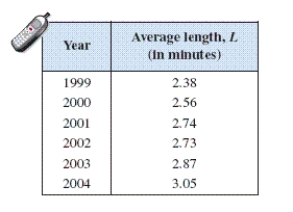 Use the regression feature of a graphing utility to find a linear model for the data. Let t represent the year, with t = 9 corresponding to 1999. Use the model to predict the average lengths of cellular phone calls for the year 2012. Round your answer to two decimal places.
(Multiple Choice)
4.8/5 (42)
Filters
- Essay(0)
- Multiple Choice(0)
- Short Answer(0)
- True False(0)
- Matching(0)