Exam 10: Measuring a Nations Income
Exam 1: Ten Principles of Economics51 Questions
Exam 2: Thinking Like an Economist9 Questions
Exam 3: Interdependence and the Gains From Trade159 Questions
Exam 4: The Market Forces of Supply and Demand94 Questions
Exam 5: Elasticity and Its Application55 Questions
Exam 6: Supply, Demand, and Government Policies35 Questions
Exam 7: Consumers, Producers, and the Efficiency of Markets35 Questions
Exam 8: Application: The Costs of Taxation35 Questions
Exam 9: Application: International Trade46 Questions
Exam 10: Measuring a Nations Income43 Questions
Exam 11: Measuring the Cost of Living45 Questions
Exam 12: Production and Growth37 Questions
Exam 13: Saving, Investment, and the Financial System53 Questions
Exam 14: The Basic Tools of Finance33 Questions
Exam 15: Unemployment and Its Natural Rate42 Questions
Exam 16: The Monetary System52 Questions
Exam 17: Money Growth and Inflation54 Questions
Exam 18: Open-Economy Macroeconomics: Basic Concepts81 Questions
Exam 19: A Macroeconomic Theory of the Open Economy81 Questions
Select questions type
The IS curve plots the relationship between the interest rate and that arises in the market for
)
(Multiple Choice)
4.8/5  (39)
(39)
In the Keynesian-cross model, if the MPC equals 0.75, then a $1 billion increase in government spending increases planned expenditures by and increases the equilibrium level of income by
)
(Multiple Choice)
4.9/5 (34)
a. Suppose Congress decides to reduce the budget deficit by cutting government spending. Use the Keynesian-cross model to illustrate graphically the impact of a reduction in government purchases on the equilibrium level of income. Be sure to label: i. the axes; ii. the curves; iii. the initial equilibrium values; iv. the direction the curve shifts; and v. the terminal equilibrium values.
b. Explain in words what happens to equilibrium income as a result of the cut in government spending and the time horizon appropriate for this analysis.
(Essay)
4.9/5 (34)
Assume that the consumption function is given by C = 200 + 0.5(Y - T) and the investment function is
I = 1,000 - 200r, where r is measured in percent, G equals 300, and T equals 200.
a. What is the numerical formula for the IS curve? (Hint: Substitute for C, I, and G
in the equation Y = C + I + G and then write an equation for Y as a function of r
or r as a function of Y.) Express the equation two ways.
b. What is the slope of the IS curve? (Hint: The slope of the IS curve is the coefficient of Y when the IS curve is written expressing r as a function of Y.)
c. If r is one percent, what is I? what is Y? If r is 3 percent, what is I? what is Y? If
r is 5 percent, what is I? what is Y?
d. If G increases, does the IS curve shift upward and to the right or downward and to the left?
(Essay)
4.8/5 (39)
a. Graphically illustrate the impact of an open-market purchase by the Federal Reserve on the equilibrium interest rate using the theory of liquidity preference and the market for real money balances. Be sure to label: i. the axes; ii. the curves; iii. the initial equilibrium values; iv. the direction the curve shifts; and v. the terminal equilibrium values.
b. Explain in words what happens to the equilibrium interest rate as a result of the open-market purchase.
(Essay)
4.8/5 (40)
a. Graphically illustrate how an increase in income affects the equilibrium levels of saving, investment, and the interest rate in the loanable funds model. Be sure to label: i. the axes; ii. the curves; iii. the initial equilibrium values; iv. the direction the curve shifts; and v. the terminal equilibrium values.
b. Explain in words what happens to the equilibrium levels of saving, investment, and the interest rates as a result of the increase in income.
(Essay)
4.9/5 (30)
In the Keynesian-cross analysis, assume that the analysis of taxes is changed so that taxes, T, are made a function of income, as in T = T + tY, where T and t are parameters of the tax code and t is positive but less than 1. As compared to a case where t is zero, the multiplier for government purchases in this case will:
(Multiple Choice)
4.8/5 (33)
The variable that links the market for goods and services and the market for real money balances in the IS-LM model is the:
(Multiple Choice)
4.8/5 (31)
For the purposes of the Keynesian cross, planned expenditure consists of:
(Multiple Choice)
4.8/5 (36)
a. Suppose Congress passes legislation that significantly reduces taxes. Use the Keynesian-cross model to illustrate graphically the impact of a reduction in taxes on the equilibrium level of income. Be sure to label: i. the axes; ii. the curves; iii. the initial equilibrium values; iv. the direction the curve shifts; and v. the terminal equilibrium values.
b. Explain in words what happens to equilibrium income as a result of the tax cut and the time horizon appropriate for this analysis.
(Essay)
4.8/5 (38)
Assume that the equilibrium in the money market may be described as M/P = 0.5Y - 100r, and M/P
equals 800.
a. Write the LM curve two ways, expressing Y as a function of r and r as a function of Y. (Hint: Write the LM curve only relating Y and r; substitute out M/P.)
b. What is the slope of the LM curve?
c. If r is 1 percent, what is Y along the LM curve? If r is 3 percent, what is Y along the LM curve? If r is 5 percent, what is Y along the LM curve?
d. If M/P increases, does the LM curve shift upward and to the left or downward and to the right?
e. If M increases and P is constant, does the LM curve shift upward and to the left or downward and to the right?
f. If P increases and M is constant, does the LM curve shift upward and to the left or downward and to the right?
(Essay)
4.8/5 (33)
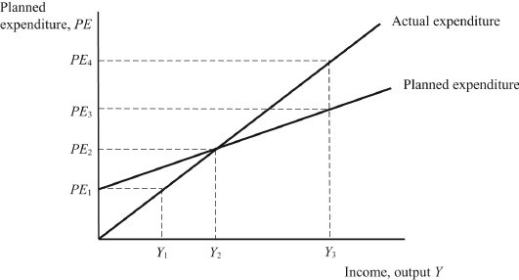
Exhibit: Keynesian Cross
 Reference: Ref 10-1
(Exhibit: Keynesian Cross) In this graph, if firms are producing at level Y , then inventories will
Inducing firms to production.
Reference: Ref 10-1
(Exhibit: Keynesian Cross) In this graph, if firms are producing at level Y , then inventories will
Inducing firms to production.
(Multiple Choice)
4.9/5 (32)
According to the analysis underlying the Keynesian cross, when planned expenditure exceeds income:
(Multiple Choice)
4.9/5 (38)
According to the Keynesian-cross analysis, when there is a shift upward in the government-purchases schedule by an amount ∆G and the planned expenditure schedule by an equal amount, then equilibrium income rises by:
(Multiple Choice)
4.8/5 (31)
Consider the impact of an increase in thriftiness in the Keynesian-cross analysis. Assume that the marginal propensity to consume is unchanged, but the intercept of the consumption function is made smaller so that at every income level saving is greater. This will:
(Multiple Choice)
4.8/5 (31)
Assume that the money demand function is (M/P)d = 2,200 - 200r, where r is the interest rate in percent. The money supply M is 2,000 and the price level P is 2. The equilibrium interest rate is
Percent.
(Multiple Choice)
5.0/5 (36)
The government-purchases multiplier indicates how much change(s) in response to a $1 change in government purchases.
(Multiple Choice)
4.8/5 (30)
Assume that the money demand function is (M/P)d = 2,200 - 200r, where r is the interest rate in percent. The money supply M is 2,000 and the price level P is 2. If the price level is fixed and the Fed wants to fix the interest rate at 7 percent, it should set the money supply at:
(Multiple Choice)
4.8/5 (39)
Filters
- Essay(0)
- Multiple Choice(0)
- Short Answer(0)
- True False(0)
- Matching(0)