Exam 7: Applications of Integration
Exam 1: Limits and Their Properties30 Questions
Exam 2: Differentiation47 Questions
Exam 3: Applications of Differentiation34 Questions
Exam 4: Integration32 Questions
Exam 5: Logarithmic, Exponential, and Other Transcendental Functions52 Questions
Exam 6: Differential Equations46 Questions
Exam 7: Applications of Integration35 Questions
Exam 8: Integration Techniques, Lhôpitals Rule, and Improper Integrals22 Questions
Exam 9: Infinite Series21 Questions
Exam 10: Conics, Parametric Equations, and Polar Coordinates30 Questions
Exam 11: Vectors and the Geometry of Space39 Questions
Exam 12: Vector-Valued Functions37 Questions
Exam 13: Functions of Several Variables40 Questions
Exam 14: Multiple Integration36 Questions
Exam 15: Vector Analysis35 Questions
Exam 16: Additional Topics in Differential Equations30 Questions
Exam 17: Preparation for Calculus58 Questions
Select questions type
Find the area of the region bounded by the graphs of the algebraic functions. 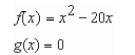
(Multiple Choice)
4.9/5  (27)
(27)
Concrete sections for the new building have the dimensions (in meters) and shape as shown in the figure (the picture is not necessarily drawn to scale).Find the area of the face of the
Section superimposed on the rectangular coordinate system.Round your answer to three decimal
Places. 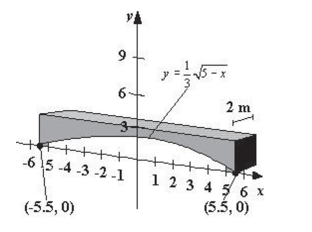
(Multiple Choice)
4.8/5 (36)
Suppose that  model the revenue (in billions of dollars) for a large corporation.The model
  gives projected annual revenues from 2008 through
2015, with
gives projected annual revenues from 2008 through
2015, with  corresponding to 2008, and
  gives projected revenues if there is a decrease in the
Rate of growth of corporate sales over the period.Approximate the total reduction in revenue if
Corporate sales are actually closer to the model
gives projected revenues if there is a decrease in the
Rate of growth of corporate sales over the period.Approximate the total reduction in revenue if
Corporate sales are actually closer to the model  Round your answer to three decimal places.
(Multiple Choice)
4.8/5 (41)
Find the volume of the solid generated by revolving the region bounded by the graphs of the equations about the given lines. 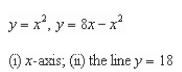
(Multiple Choice)
5.0/5 (38)
Find the volume of the solid generated by revolving the region bounded by the graphs of the equations about the given lines. 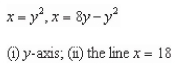
(Multiple Choice)
4.8/5 (40)
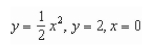
Find the area of the region bounded by the equations by integrating (i) with respect to x and
(ii) with respect to y. 
(Multiple Choice)
4.8/5 (34)
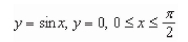
Set up and evaluate the integral that gives the volume of the solid formed by revolving the region bounded by 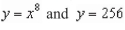 in the first quadrant about the -axis.
(Multiple Choice)
4.8/5 (40)
Find the area of the region bounded by the graphs of the equations. 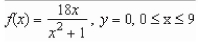
(Multiple Choice)
4.9/5 (36)
Find the area of the region bounded by the graphs of the algebraic functions. 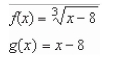
(Multiple Choice)
4.8/5 (34)
Set up and evaluate the integral that gives the volume of the solid formed by revolving the region bounded by 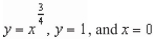 about the -axis.
(Multiple Choice)
4.8/5 (42)
Find the volume of the solid generated by revolving the region bounded by the graphs of the equations about the line 
(Multiple Choice)
4.8/5 (43)
Find the volume of the solid generated by revolving the region bounded by the graphs of the equations about the line 
(Multiple Choice)
4.7/5 (41)
Find the volume of the solid generated by revolving the region bounded by the graphs of the equations about the given lines. 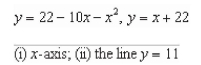
(Multiple Choice)
4.9/5 (46)
Find the area of the region bounded by the graphs of the function 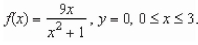 Round your answer to three decimal places.
(Multiple Choice)
4.7/5 (39)
Find the volume of the solid generated by revolving the region bounded by the graphs of the equations  axis.Round your
Answer to four decimal places.
axis.Round your
Answer to four decimal places.
(Multiple Choice)
5.0/5 (44)
Filters
- Essay(0)
- Multiple Choice(0)
- Short Answer(0)
- True False(0)
- Matching(0)