Exam 5: Introduction to Macroeconomics
Exam 1: The Art and Science of Economic Analysis150 Questions
Exam 2: Some Tools of Economic Analysis159 Questions
Exam 3: Economic Decision Makers174 Questions
Exam 4: Demand, Supply, and Markets152 Questions
Exam 5: Introduction to Macroeconomics151 Questions
Exam 6: Tracking the U S Economy150 Questions
Exam 7: Unemployment and Inflation150 Questions
Exam 8: Us Productivity and Growth150 Questions
Exam 9: Aggregate Demand150 Questions
Exam 10: Aggregate Supply150 Questions
Exam 11: Fiscal Policy151 Questions
Exam 12: Federal Budgets and Public Policy153 Questions
Exam 13: Money and the Financial System150 Questions
Exam 14: Banking and the Money Supply150 Questions
Exam 15: Monetary Theory and Policy150 Questions
Exam 16: The Policy Debate: Active or Passive150 Questions
Exam 17: International Trade150 Questions
Exam 18: International Finance150 Questions
Exam 19: Economic Development150 Questions
Select questions type
If the real GDP of a country in 2011 was 300 billion, its price index was 108.3, and its population was 150 billion, then real GDP per capita for that year was:
(Multiple Choice)
4.7/5  (30)
(30)
An economic variable that is measured per unit of time, such as spending per year, is known as a:
(Multiple Choice)
4.9/5 (36)
Suppose an economy is initially in equilibrium and there is a sudden increase in oil prices. Which of the following is the most likely result?
(Multiple Choice)
4.9/5 (33)
Which of the following economic measures is most useful in comparing different economies across the world?
(Multiple Choice)
4.8/5 (48)
Which of the following statements regarding the gross domestic product is true?
(Multiple Choice)
4.9/5 (26)
If the price level in the U.S. increases, aggregate output demanded:
(Multiple Choice)
5.0/5 (37)
Which of these faulty economic policies was adopted by President Hoover during the Great Depression?
(Multiple Choice)
4.8/5 (47)
Which of the following decades is known as the "Golden Age of Keynesian Economics"?
(Multiple Choice)
4.8/5 (30)
Which of the following is the significance of a country's price index?
(Multiple Choice)
4.7/5 (43)
Which of these changes was observed in the U.S. between 1929 and 1933?
(Multiple Choice)
4.8/5 (38)
The gross domestic product measures the value of all final goods and services produced by resources owned by a nation.
(True/False)
4.8/5 (34)
Since the Great Depression, business fluctuations have become more severe and longer in duration.
(True/False)
4.8/5 (33)
Economists use the price index to eliminate year-to-year changes in GDP due solely to changes in:
(Multiple Choice)
4.9/5 (42)
Macroeconomic equilibrium is best described as a situation in which:
(Multiple Choice)
4.8/5 (43)
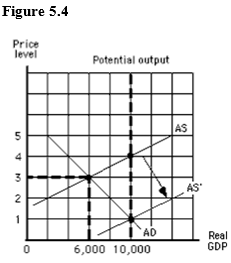
The figure below shows the aggregate demand and supply curves for the U.S. A rightward shift of the aggregate supply curve from AS to AS' would be caused by:
(Multiple Choice)
4.8/5 (40)
Which of the following can be concluded about the long-run performance of the U.S. economy?
(Multiple Choice)
4.8/5 (30)
Which of the following was true of the U.S. job market between 1929 and 2011?
(Multiple Choice)
4.7/5 (33)
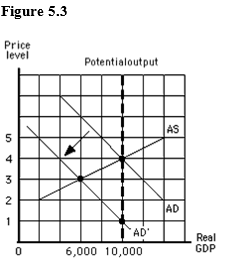
The figure below shows the aggregate demand and supply curves for the U.S. The figure given below shows that the price level changes from _____ when the aggregate supply curve shifts from AS' to AS''.
(Multiple Choice)
4.8/5 (42)
For a given aggregate supply curve, price level and output will both increase when aggregate demand decreases.
(True/False)
4.7/5 (38)
Stagflation is a situation with high unemployment rates, high inflation rates, and little or no growth in the economy.
(True/False)
4.9/5 (34)
Filters
- Essay(0)
- Multiple Choice(0)
- Short Answer(0)
- True False(0)
- Matching(0)